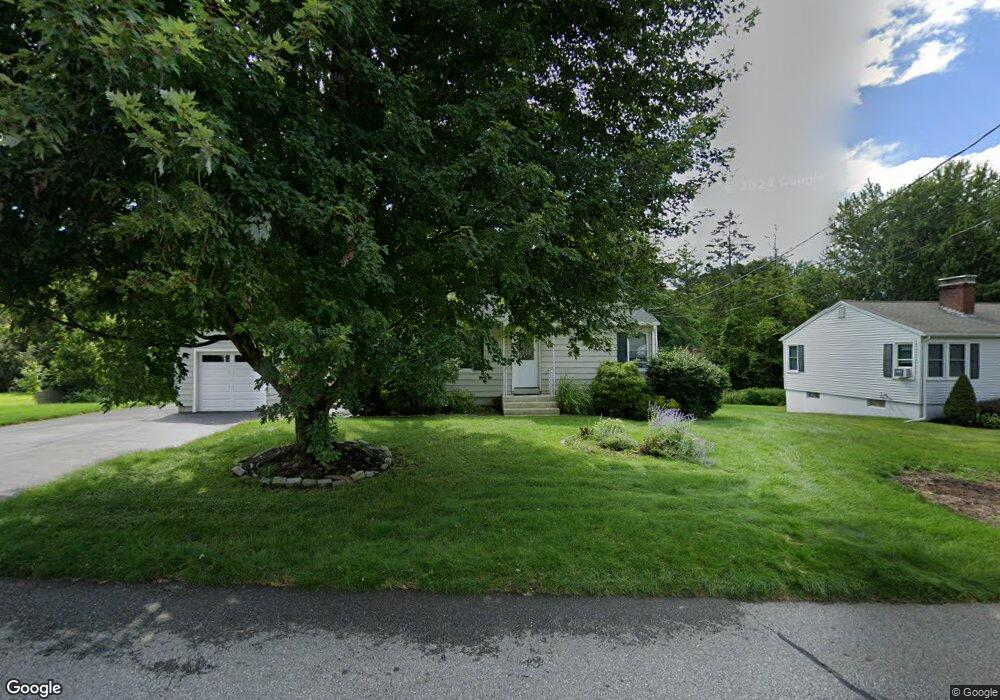
95 Stoneleigh Rd Holden, MA 01520
Estimated Value: $407,000 - $447,000
2
Beds
2
Baths
1,052
Sq Ft
$411/Sq Ft
Est. Value
About This Home
This home is located at 95 Stoneleigh Rd, Holden, MA 01520 and is currently estimated at $432,153, approximately $410 per square foot. 95 Stoneleigh Rd is a home located in Worcester County with nearby schools including Wachusett Regional High School and Bancroft School.
Ownership History
Date
Name
Owned For
Owner Type
Purchase Details
Closed on
Dec 15, 2005
Sold by
Hillenburg Kristie L and Zaik Mary C
Bought by
Gentile James C
Current Estimated Value
Home Financials for this Owner
Home Financials are based on the most recent Mortgage that was taken out on this home.
Original Mortgage
$175,000
Interest Rate
6.34%
Mortgage Type
Purchase Money Mortgage
Purchase Details
Closed on
May 2, 1997
Sold by
Slattery Richard H and Slattery Jane
Bought by
Zaik Mary C and Hillenburg Kristie
Purchase Details
Closed on
Jan 30, 1991
Sold by
Johnson Hubert B and Johnson Philip E
Bought by
Slattery Richaed H and Slattery Alison M
Create a Home Valuation Report for This Property
The Home Valuation Report is an in-depth analysis detailing your home's value as well as a comparison with similar homes in the area
Home Values in the Area
Average Home Value in this Area
Purchase History
| Date | Buyer | Sale Price | Title Company |
|---|---|---|---|
| Gentile James C | $264,000 | -- | |
| Zaik Mary C | $104,000 | -- | |
| Slattery Richaed H | $104,000 | -- |
Source: Public Records
Mortgage History
| Date | Status | Borrower | Loan Amount |
|---|---|---|---|
| Open | Slattery Richaed H | $174,000 | |
| Closed | Gentile James C | $175,000 | |
| Previous Owner | Slattery Richaed H | $85,000 | |
| Previous Owner | Slattery Richaed H | $15,000 |
Source: Public Records
Tax History
| Year | Tax Paid | Tax Assessment Tax Assessment Total Assessment is a certain percentage of the fair market value that is determined by local assessors to be the total taxable value of land and additions on the property. | Land | Improvement |
|---|---|---|---|---|
| 2025 | $5,306 | $382,800 | $139,700 | $243,100 |
| 2024 | $4,907 | $346,800 | $135,600 | $211,200 |
| 2023 | $4,743 | $316,400 | $117,900 | $198,500 |
| 2022 | $4,604 | $278,000 | $92,100 | $185,900 |
| 2021 | $4,940 | $255,900 | $87,700 | $168,200 |
| 2020 | $4,107 | $241,600 | $83,500 | $158,100 |
| 2019 | $4,345 | $231,500 | $83,500 | $148,000 |
| 2018 | $3,688 | $209,400 | $79,600 | $129,800 |
| 2017 | $3,599 | $204,600 | $79,600 | $125,000 |
| 2016 | $3,381 | $196,000 | $75,800 | $120,200 |
| 2015 | $3,376 | $186,300 | $75,800 | $110,500 |
| 2014 | $3,307 | $186,300 | $75,800 | $110,500 |
Source: Public Records
Map
Nearby Homes
- 21 Wyoming Dr
- 30 Osgood Ave
- 250 Shrewsbury St
- 39 Mountainshire Dr
- 22 Danielles Way
- 26 Danielles Way
- 31 Danielles Way
- 270 Brattle St
- 307 Bullard St
- 120 Brattle St
- 7 Alpine Dr
- 1110 W Boylston St Unit A
- 10 Beale St
- 48 Whispering Pine Cir Unit 48
- 1 Highland Ave
- 53 Collins St
- 740 Burncoat St Unit B
- 23 Gail Dr
- 218 Holden St
- 42 N Worcester Ave
- 89 Stoneleigh Rd
- 101 Stoneleigh Rd
- 26 Cook St
- 24 Cook St
- 94 Stoneleigh Rd
- 28 Cook St
- 102 Stoneleigh Rd
- 102 Stoneleigh Rd Unit 1
- 86 Stoneleigh Rd
- 113 Stoneleigh Rd
- 10 Harold St
- 20 Cook St
- 80 Stoneleigh Rd
- 108 Stoneleigh Rd
- 123 Stoneleigh Rd
- 63 Winfield Rd
- 57 Winfield Rd
- 74 Stoneleigh Rd
- 27 Cook St
- 71 Winfield Rd
Your Personal Tour Guide
Ask me questions while you tour the home.