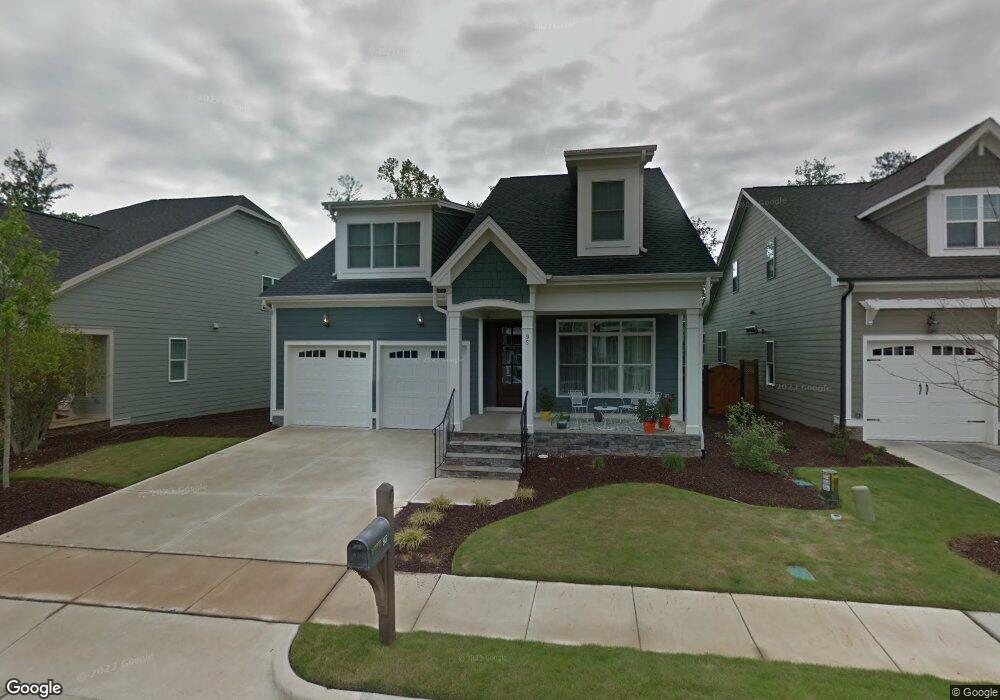
95 Tyner Loop Cir Unit Lot 1151 Chapel Hill, NC 27516
Estimated Value: $686,000 - $849,000
3
Beds
3
Baths
2,832
Sq Ft
$278/Sq Ft
Est. Value
About This Home
This home is located at 95 Tyner Loop Cir Unit Lot 1151, Chapel Hill, NC 27516 and is currently estimated at $787,391, approximately $278 per square foot. 95 Tyner Loop Cir Unit Lot 1151 is a home located in Chatham County with nearby schools including Margaret B. Pollard Middle School and Woods Charter.
Ownership History
Date
Name
Owned For
Owner Type
Purchase Details
Closed on
Dec 20, 2021
Sold by
Martin Stephen S and Cogswell Martin Virginia
Bought by
Appulingam Subramaniam and Appulingam Anbuchelvi
Current Estimated Value
Purchase Details
Closed on
Oct 26, 2015
Sold by
Homes By Dickerson Inc
Bought by
Martin Stephen S and Cogswell Martin Virginia M
Home Financials for this Owner
Home Financials are based on the most recent Mortgage that was taken out on this home.
Original Mortgage
$384,400
Interest Rate
3.78%
Mortgage Type
New Conventional
Purchase Details
Closed on
Jun 9, 2015
Sold by
Nnp Briar Chapel Llc
Bought by
Homes By Dickerson Inc
Home Financials for this Owner
Home Financials are based on the most recent Mortgage that was taken out on this home.
Original Mortgage
$378,591
Interest Rate
3.92%
Mortgage Type
Construction
Create a Home Valuation Report for This Property
The Home Valuation Report is an in-depth analysis detailing your home's value as well as a comparison with similar homes in the area
Home Values in the Area
Average Home Value in this Area
Purchase History
| Date | Buyer | Sale Price | Title Company |
|---|---|---|---|
| Appulingam Subramaniam | $630,000 | None Available | |
| Martin Stephen S | $481,000 | Attorney | |
| Homes By Dickerson Inc | $80,000 | Attorney |
Source: Public Records
Mortgage History
| Date | Status | Borrower | Loan Amount |
|---|---|---|---|
| Previous Owner | Martin Stephen S | $384,400 | |
| Previous Owner | Homes By Dickerson Inc | $378,591 |
Source: Public Records
Tax History Compared to Growth
Tax History
| Year | Tax Paid | Tax Assessment Tax Assessment Total Assessment is a certain percentage of the fair market value that is determined by local assessors to be the total taxable value of land and additions on the property. | Land | Improvement |
|---|---|---|---|---|
| 2025 | $2,825 | $782,362 | $110,580 | $671,782 |
| 2024 | $2,825 | $497,139 | $93,120 | $404,019 |
| 2023 | $4,018 | $497,139 | $93,120 | $404,019 |
| 2022 | $4,018 | $497,139 | $93,120 | $404,019 |
| 2021 | $3,968 | $497,139 | $93,120 | $404,019 |
| 2020 | $3,848 | $478,512 | $75,000 | $403,512 |
| 2019 | $3,848 | $478,512 | $75,000 | $403,512 |
| 2018 | $3,589 | $478,512 | $75,000 | $403,512 |
| 2017 | $3,623 | $478,512 | $75,000 | $403,512 |
| 2016 | $2,849 | $369,669 | $75,000 | $294,669 |
| 2015 | $489 | $67,500 | $67,500 | $0 |
Source: Public Records
Map
Nearby Homes
- 18 Monarch Trail
- 235 Mallard Landing Dr
- 418 Quarter Gate Trace
- 40 Mallard Landing Dr
- 49 Salt Cedar Ln
- 62 Salt Cedar Ln
- 260 Quarter Gate Trace
- 2311 Great Ridge Pkwy
- 47 Balfour Run
- 366 Granite Mill Blvd
- 136 Serenity Hill Cir
- 438 Granite Mill Blvd
- 59 Tobacco Farm Way
- 157 Wildwind Dr
- 265 Tobacco Farm Way
- 1420 Briar Chapel Pkwy
- 656 Granite Mill Blvd
- 562 Beacon Ridge Blvd
- 347 Dark Forest Dr
- 38 Owen Towne Rd
- 95 Tyner Loop Cir
- 85 Tyner Loop Cir Unit Lt1150
- 85 Tyner Loop Cir Unit Lt1050
- 105 Tyner Loop Cir Unit Lot 1152
- 115 Tyner Loop Cir Unit Lot 1153
- 73 Tyner Loop Cir Unit Lt1149
- 92 Tyner Loop Cir
- 125 Tyner Loop Cir Unit Lt1154
- 102 Tyner Loop Cir
- 63 Tyner Loop Cir Unit Lt1148
- 112 Tyner Loop Cir
- 120 Tyner Loop Cir
- 12 Monarch Trail
- 24 Monarch Trail
- 137 Tyner Loop Cir
- 137 Tyner Loop Cir Unit Lt1155
- 53 Tyner Loop Cir
- 132 Tyner Loop Cir
- 30 Monarch Trail
- 45 Monarch Trail