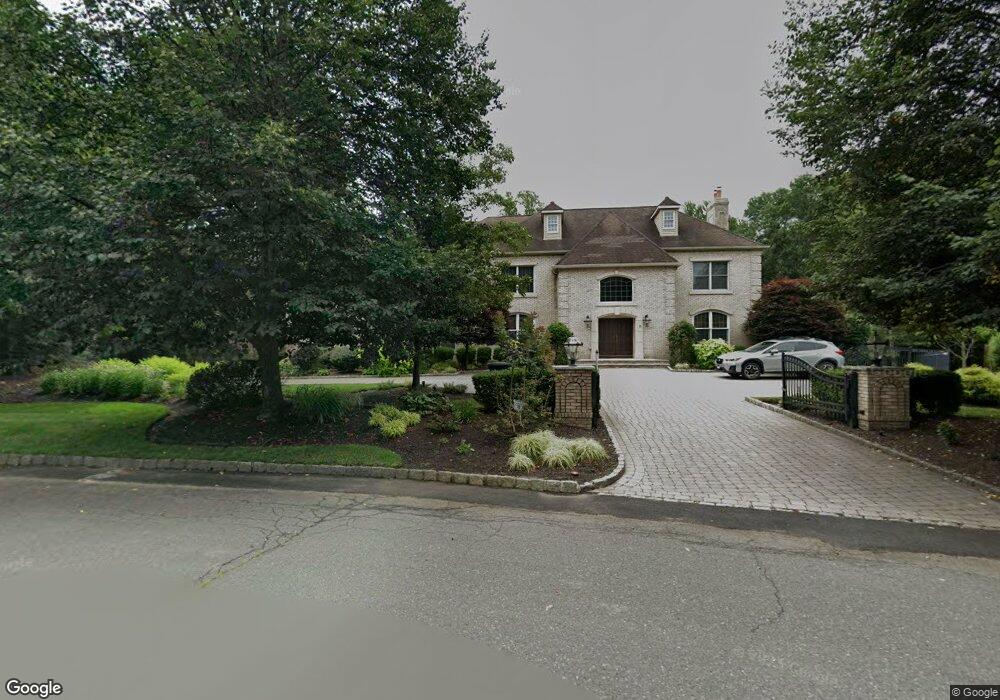
95 Valley Rd Allendale, NJ 07401
Estimated Value: $1,733,000 - $2,442,000
--
Bed
--
Bath
6,160
Sq Ft
$346/Sq Ft
Est. Value
About This Home
This home is located at 95 Valley Rd, Allendale, NJ 07401 and is currently estimated at $2,129,936, approximately $345 per square foot. 95 Valley Rd is a home located in Bergen County with nearby schools including Hillside Elementary School, Brookside Elementary School, and Northern Highlands Reg High School.
Ownership History
Date
Name
Owned For
Owner Type
Purchase Details
Closed on
Apr 17, 1996
Sold by
Borra William
Bought by
Segovia Fernando and Segovia Lucia
Current Estimated Value
Home Financials for this Owner
Home Financials are based on the most recent Mortgage that was taken out on this home.
Original Mortgage
$705,000
Outstanding Balance
$34,203
Interest Rate
7.67%
Estimated Equity
$2,095,734
Create a Home Valuation Report for This Property
The Home Valuation Report is an in-depth analysis detailing your home's value as well as a comparison with similar homes in the area
Home Values in the Area
Average Home Value in this Area
Purchase History
| Date | Buyer | Sale Price | Title Company |
|---|---|---|---|
| Segovia Fernando | $320,000 | -- |
Source: Public Records
Mortgage History
| Date | Status | Borrower | Loan Amount |
|---|---|---|---|
| Open | Segovia Fernando | $705,000 |
Source: Public Records
Tax History Compared to Growth
Tax History
| Year | Tax Paid | Tax Assessment Tax Assessment Total Assessment is a certain percentage of the fair market value that is determined by local assessors to be the total taxable value of land and additions on the property. | Land | Improvement |
|---|---|---|---|---|
| 2025 | $35,189 | $1,743,000 | $616,500 | $1,126,500 |
| 2024 | $34,801 | $1,668,500 | $599,800 | $1,068,700 |
| 2023 | $32,998 | $1,582,600 | $542,800 | $1,039,800 |
| 2022 | $32,998 | $1,449,200 | $454,600 | $994,600 |
| 2021 | $33,018 | $1,567,600 | $440,300 | $1,127,300 |
| 2020 | $37,242 | $1,543,400 | $433,200 | $1,110,200 |
| 2019 | $36,254 | $1,543,400 | $433,200 | $1,110,200 |
| 2018 | $35,452 | $1,543,400 | $433,200 | $1,110,200 |
| 2017 | $35,313 | $1,543,400 | $433,200 | $1,110,200 |
| 2016 | $35,359 | $1,543,400 | $433,200 | $1,110,200 |
| 2015 | $34,649 | $1,543,400 | $433,200 | $1,110,200 |
| 2014 | $38,693 | $1,623,700 | $433,200 | $1,190,500 |
Source: Public Records
Map
Nearby Homes