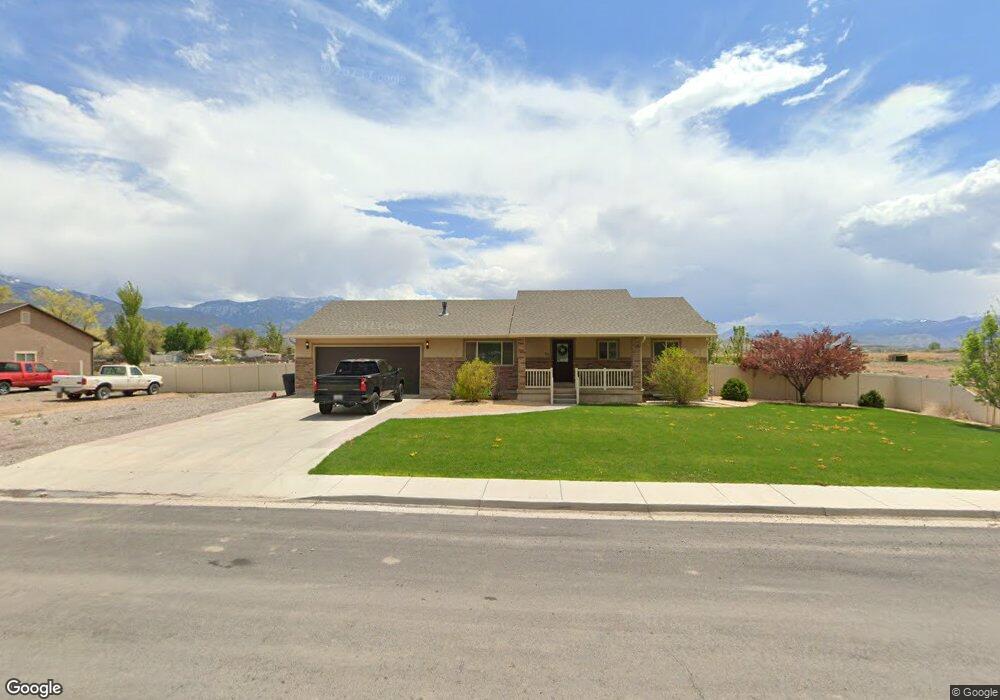
95 W 100 S Unit 3 Elsinore, UT 84724
Estimated Value: $392,000 - $477,074
5
Beds
3
Baths
2,688
Sq Ft
$162/Sq Ft
Est. Value
About This Home
This home is located at 95 W 100 S Unit 3, Elsinore, UT 84724 and is currently estimated at $436,269, approximately $162 per square foot. 95 W 100 S Unit 3 is a home located in Sevier County with nearby schools including Monroe School, South Sevier Middle School, and South Sevier High School.
Ownership History
Date
Name
Owned For
Owner Type
Purchase Details
Closed on
Apr 27, 2023
Sold by
Rickenbach Trent
Bought by
Sirrine Tanner J
Current Estimated Value
Home Financials for this Owner
Home Financials are based on the most recent Mortgage that was taken out on this home.
Original Mortgage
$425,000
Outstanding Balance
$413,628
Interest Rate
6.6%
Mortgage Type
VA
Estimated Equity
$22,641
Purchase Details
Closed on
Oct 28, 2019
Sold by
Sawyer Ronald
Bought by
Rickenbach Trent
Home Financials for this Owner
Home Financials are based on the most recent Mortgage that was taken out on this home.
Original Mortgage
$275,910
Interest Rate
3.5%
Mortgage Type
FHA
Purchase Details
Closed on
Oct 21, 2013
Sold by
Sevier Heating Atr & Conditioning Inc
Bought by
Sawyer Ronald
Home Financials for this Owner
Home Financials are based on the most recent Mortgage that was taken out on this home.
Original Mortgage
$167,200
Interest Rate
4.55%
Mortgage Type
New Conventional
Create a Home Valuation Report for This Property
The Home Valuation Report is an in-depth analysis detailing your home's value as well as a comparison with similar homes in the area
Home Values in the Area
Average Home Value in this Area
Purchase History
| Date | Buyer | Sale Price | Title Company |
|---|---|---|---|
| Sirrine Tanner J | -- | First American Title | |
| Rickenbach Trent | -- | First American Title Ins Co | |
| Sawyer Ronald | -- | Utah Title & Asbstra |
Source: Public Records
Mortgage History
| Date | Status | Borrower | Loan Amount |
|---|---|---|---|
| Open | Sirrine Tanner J | $425,000 | |
| Previous Owner | Rickenbach Trent | $275,910 | |
| Previous Owner | Sawyer Ronald | $167,200 |
Source: Public Records
Tax History Compared to Growth
Tax History
| Year | Tax Paid | Tax Assessment Tax Assessment Total Assessment is a certain percentage of the fair market value that is determined by local assessors to be the total taxable value of land and additions on the property. | Land | Improvement |
|---|---|---|---|---|
| 2024 | $3,666 | $415,927 | $64,625 | $351,302 |
| 2023 | $3,666 | $218,299 | $26,008 | $192,291 |
| 2022 | $1,826 | $180,255 | $21,551 | $158,704 |
| 2021 | $1,867 | $152,384 | $18,920 | $133,464 |
| 2020 | $1,720 | $131,458 | $11,825 | $119,633 |
| 2019 | $1,548 | $126,130 | $11,830 | $114,300 |
| 2018 | $1,463 | $105,960 | $11,830 | $94,130 |
| 2017 | $1,431 | $99,240 | $11,830 | $87,410 |
| 2016 | -- | $99,390 | $0 | $0 |
| 2015 | -- | $99,390 | $0 | $0 |
| 2014 | -- | $99,390 | $0 | $0 |
Source: Public Records
Map
Nearby Homes