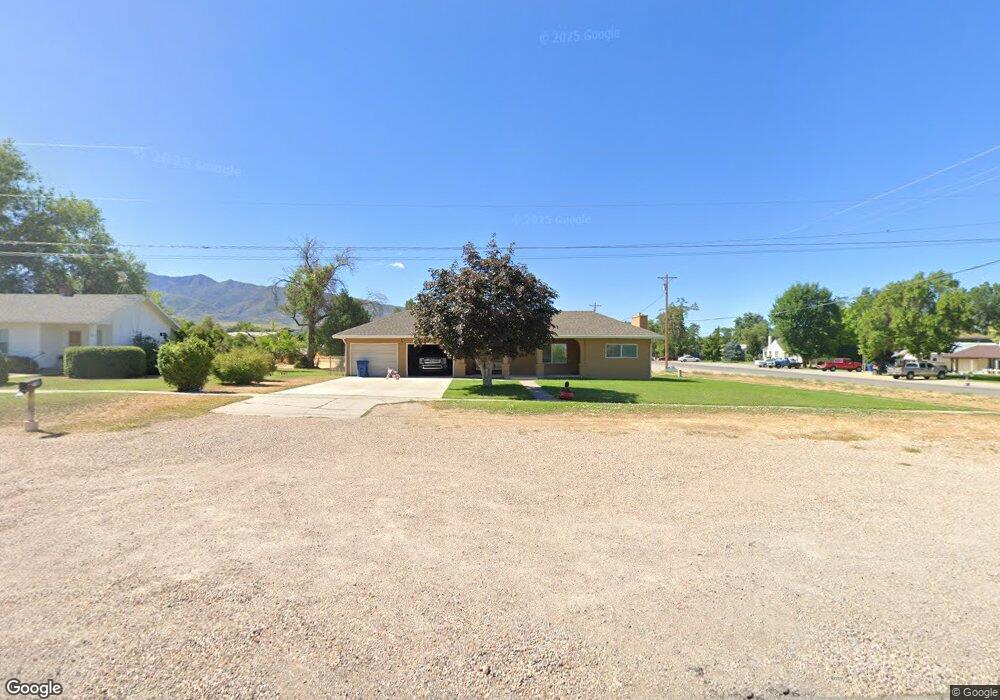
95 W 200 S Fillmore, UT 84631
Estimated Value: $310,000 - $440,000
3
Beds
2
Baths
2,025
Sq Ft
$177/Sq Ft
Est. Value
About This Home
This home is located at 95 W 200 S, Fillmore, UT 84631 and is currently estimated at $357,641, approximately $176 per square foot. 95 W 200 S is a home located in Millard County.
Ownership History
Date
Name
Owned For
Owner Type
Purchase Details
Closed on
Dec 7, 2020
Sold by
Martinez Samuel and Martinez Armida
Bought by
Gomez Gerardo Ruvalcaba
Current Estimated Value
Home Financials for this Owner
Home Financials are based on the most recent Mortgage that was taken out on this home.
Original Mortgage
$233,244
Outstanding Balance
$207,080
Interest Rate
2.8%
Mortgage Type
New Conventional
Estimated Equity
$150,561
Purchase Details
Closed on
Sep 2, 2016
Sold by
Rna Investments Llc
Bought by
Martinez Samuel and Martinez Armida
Purchase Details
Closed on
Dec 30, 2013
Bought by
The Secretary Of Housing And Urban Devel
Purchase Details
Closed on
Dec 9, 2013
Sold by
Beck Justian D
Bought by
Community Lending Incorporated A Califor
Purchase Details
Closed on
May 18, 2005
Sold by
Higgins John W
Bought by
Beck Justian D
Home Financials for this Owner
Home Financials are based on the most recent Mortgage that was taken out on this home.
Original Mortgage
$101,310
Interest Rate
5.84%
Mortgage Type
FHA
Create a Home Valuation Report for This Property
The Home Valuation Report is an in-depth analysis detailing your home's value as well as a comparison with similar homes in the area
Home Values in the Area
Average Home Value in this Area
Purchase History
| Date | Buyer | Sale Price | Title Company |
|---|---|---|---|
| Gomez Gerardo Ruvalcaba | -- | First American Title | |
| Martinez Samuel | -- | First American Title | |
| The Secretary Of Housing And Urban Devel | -- | -- | |
| Community Lending Incorporated A Califor | $59,500 | -- | |
| Beck Justian D | -- | First American Title Insuran |
Source: Public Records
Mortgage History
| Date | Status | Borrower | Loan Amount |
|---|---|---|---|
| Open | Gomez Gerardo Ruvalcaba | $233,244 | |
| Previous Owner | Beck Justian D | $101,310 |
Source: Public Records
Tax History Compared to Growth
Tax History
| Year | Tax Paid | Tax Assessment Tax Assessment Total Assessment is a certain percentage of the fair market value that is determined by local assessors to be the total taxable value of land and additions on the property. | Land | Improvement |
|---|---|---|---|---|
| 2025 | $1,477 | $185,549 | $22,046 | $163,503 |
| 2024 | $1,477 | $167,658 | $20,292 | $147,366 |
| 2023 | $1,812 | $167,658 | $20,292 | $147,366 |
| 2022 | $1,520 | $136,441 | $18,448 | $117,993 |
| 2021 | $1,345 | $115,925 | $11,979 | $103,946 |
| 2020 | $1,207 | $104,649 | $10,890 | $93,759 |
| 2019 | $1,023 | $88,966 | $10,890 | $78,076 |
| 2018 | $975 | $86,765 | $10,890 | $75,875 |
| 2017 | $809 | $68,496 | $10,890 | $57,606 |
| 2016 | $774 | $68,496 | $10,890 | $57,606 |
| 2015 | $774 | $68,496 | $10,890 | $57,606 |
| 2014 | -- | $68,496 | $10,890 | $57,606 |
| 2013 | -- | $68,496 | $10,890 | $57,606 |
Source: Public Records
Map
Nearby Homes
- 190 W 400 St S
- 40 S 100 Rd E
- 220 S 200 E
- 75 N 100 West St
- 155 E 500 St S
- 157 E 500 South St
- 165 N 100 W
- 310 S 500 West Rd
- 225 W 200 St N
- 405 E 500 St S
- 430 E Canyon Rd
- 295 N 100 West St
- 310 S 600 E
- 390 N 100 W
- 380 N 200 St W
- 335 W 400 North St
- 760 E 700 St S
- 690 E 500 S
- 750 800 South Fillmore
- 825 800 South Fillmore