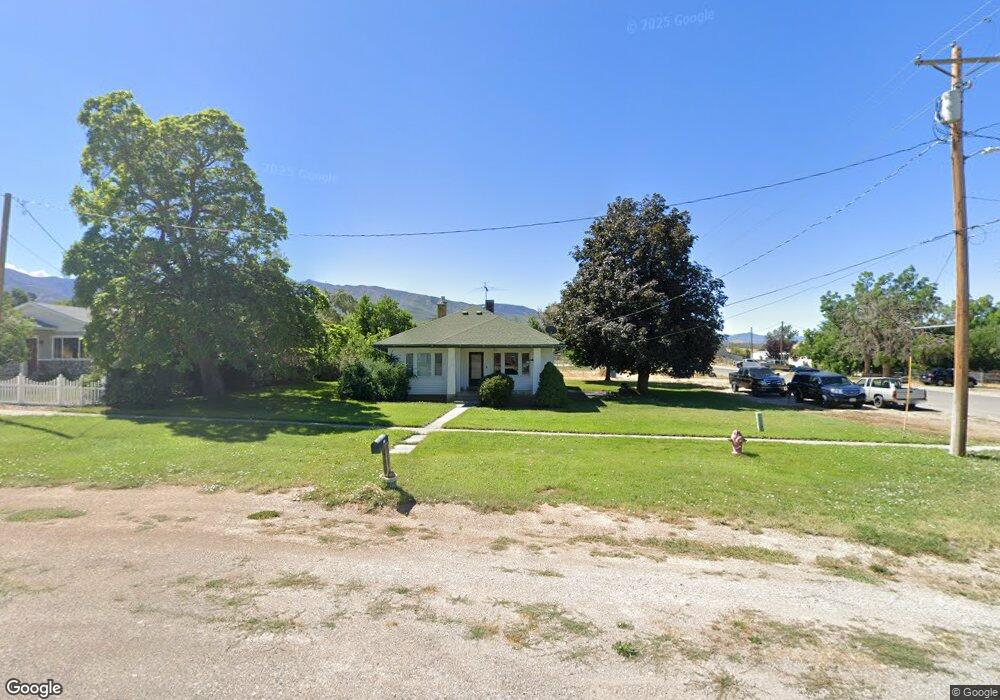
95 W 400 S Fillmore, UT 84631
Estimated Value: $254,000 - $555,000
4
Beds
1
Bath
1,626
Sq Ft
$217/Sq Ft
Est. Value
About This Home
This home is located at 95 W 400 S, Fillmore, UT 84631 and is currently estimated at $352,143, approximately $216 per square foot. 95 W 400 S is a home located in Millard County.
Ownership History
Date
Name
Owned For
Owner Type
Purchase Details
Closed on
Aug 27, 2020
Sold by
Flynn Cheryl L and Flynn Joseph P
Bought by
Pulido Edison A
Current Estimated Value
Home Financials for this Owner
Home Financials are based on the most recent Mortgage that was taken out on this home.
Original Mortgage
$166,666
Outstanding Balance
$147,232
Interest Rate
2.9%
Mortgage Type
New Conventional
Estimated Equity
$194,699
Purchase Details
Closed on
May 7, 2010
Sold by
Coleman Pearlie M and Mitchell Cecilia
Bought by
Flynn Cheryl L and Flynn Joseph P
Home Financials for this Owner
Home Financials are based on the most recent Mortgage that was taken out on this home.
Original Mortgage
$153,927
Interest Rate
5.21%
Mortgage Type
FHA
Purchase Details
Closed on
Jun 22, 2009
Sold by
Coleman Harold S and Coleman Pearlie M
Bought by
Coleman Harold S and Coleman Peralie M
Create a Home Valuation Report for This Property
The Home Valuation Report is an in-depth analysis detailing your home's value as well as a comparison with similar homes in the area
Home Values in the Area
Average Home Value in this Area
Purchase History
| Date | Buyer | Sale Price | Title Company |
|---|---|---|---|
| Pulido Edison A | -- | First American Title Insuran | |
| Flynn Cheryl L | -- | -- | |
| Coleman Harold S | -- | -- |
Source: Public Records
Mortgage History
| Date | Status | Borrower | Loan Amount |
|---|---|---|---|
| Open | Pulido Edison A | $166,666 | |
| Previous Owner | Flynn Cheryl L | $153,927 |
Source: Public Records
Tax History Compared to Growth
Tax History
| Year | Tax Paid | Tax Assessment Tax Assessment Total Assessment is a certain percentage of the fair market value that is determined by local assessors to be the total taxable value of land and additions on the property. | Land | Improvement |
|---|---|---|---|---|
| 2025 | $1,160 | $145,656 | $22,696 | $122,960 |
| 2024 | $1,160 | $112,327 | $20,292 | $92,035 |
| 2023 | $1,244 | $112,327 | $20,292 | $92,035 |
| 2022 | $1,038 | $93,164 | $18,448 | $74,716 |
| 2021 | $902 | $77,801 | $11,979 | $65,822 |
| 2020 | $844 | $73,148 | $10,890 | $62,258 |
| 2019 | $722 | $62,798 | $10,890 | $51,908 |
| 2018 | $690 | $61,460 | $10,890 | $50,570 |
| 2017 | $858 | $72,632 | $19,800 | $52,832 |
| 2016 | $821 | $72,632 | $19,800 | $52,832 |
| 2015 | $821 | $72,632 | $19,800 | $52,832 |
| 2014 | -- | $72,632 | $19,800 | $52,832 |
| 2013 | -- | $72,632 | $19,800 | $52,832 |
Source: Public Records
Map
Nearby Homes
- 190 W 400 St S
- 155 E 500 St S
- 157 E 500 South St
- 220 S 200 E
- 405 E 500 St S
- 40 S 100 Rd E
- 310 S 500 West Rd
- 75 N 100 West St
- 430 E Canyon Rd
- 760 E 700 St S
- 165 N 100 W
- 310 S 600 E
- 225 W 200 St N
- 690 E 500 S
- 295 N 100 West St
- 390 N 100 W
- 380 N 200 St W
- 1100 S 725 Rd W
- 750 800 South Fillmore
- 825 800 South Fillmore