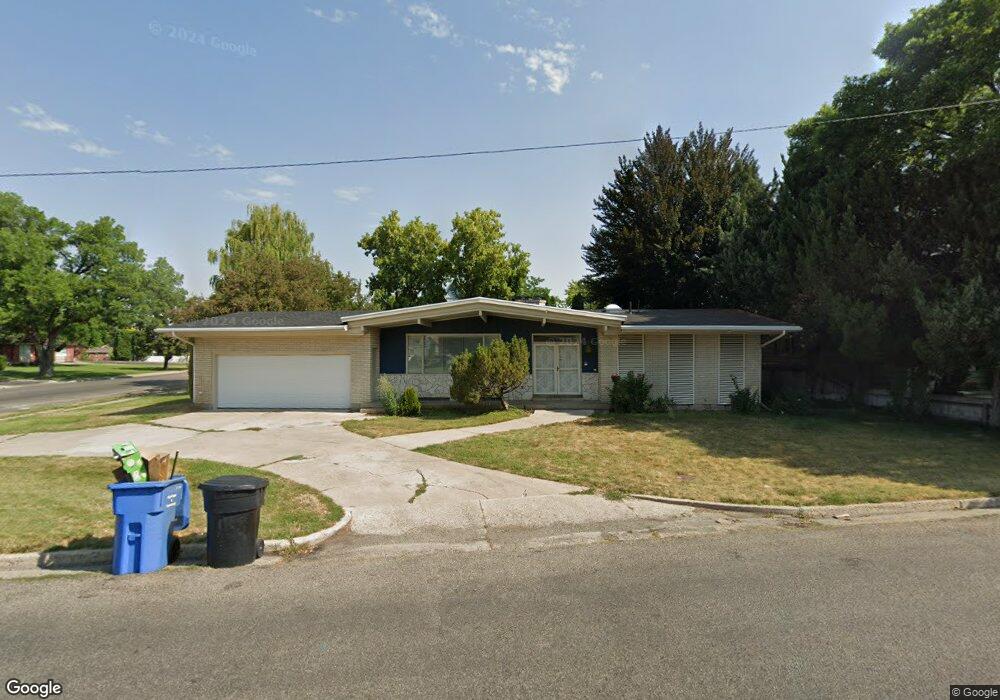
95 W 600 N Logan, UT 84321
Ellis NeighborhoodEstimated Value: $403,000 - $560,000
4
Beds
3
Baths
3,372
Sq Ft
$137/Sq Ft
Est. Value
About This Home
This home is located at 95 W 600 N, Logan, UT 84321 and is currently estimated at $463,562, approximately $137 per square foot. 95 W 600 N is a home located in Cache County with nearby schools including Bridger School, Mount Logan Middle School, and Logan High School.
Ownership History
Date
Name
Owned For
Owner Type
Purchase Details
Closed on
Nov 20, 2018
Sold by
Awada Salam
Bought by
Phoenicia Enterprises Llc
Current Estimated Value
Purchase Details
Closed on
Sep 5, 2018
Sold by
Robert Dean Holdings Llc
Bought by
Awada Salam
Purchase Details
Closed on
Feb 16, 2010
Sold by
Dean Robert C
Bought by
Robert Dean Holdings Llc
Create a Home Valuation Report for This Property
The Home Valuation Report is an in-depth analysis detailing your home's value as well as a comparison with similar homes in the area
Home Values in the Area
Average Home Value in this Area
Purchase History
| Date | Buyer | Sale Price | Title Company |
|---|---|---|---|
| Phoenicia Enterprises Llc | -- | Advanced Title | |
| Awada Salam | -- | Advanced Title Insurance Age | |
| Robert Dean Holdings Llc | -- | None Available |
Source: Public Records
Tax History
| Year | Tax Paid | Tax Assessment Tax Assessment Total Assessment is a certain percentage of the fair market value that is determined by local assessors to be the total taxable value of land and additions on the property. | Land | Improvement |
|---|---|---|---|---|
| 2025 | $1,687 | $218,235 | $0 | $0 |
| 2023 | $1,819 | $217,180 | $0 | $0 |
| 2022 | $1,948 | $217,180 | $0 | $0 |
| 2021 | $1,529 | $263,390 | $42,000 | $221,390 |
| 2020 | $1,369 | $212,300 | $42,000 | $170,300 |
| 2019 | $1,431 | $212,300 | $42,000 | $170,300 |
| 2018 | $1,475 | $199,808 | $42,000 | $157,808 |
| 2017 | $1,405 | $100,595 | $0 | $0 |
| 2016 | $1,457 | $95,095 | $0 | $0 |
| 2015 | $1,379 | $95,095 | $0 | $0 |
| 2014 | $1,246 | $95,095 | $0 | $0 |
| 2013 | -- | $94,180 | $0 | $0 |
Source: Public Records
Map
Nearby Homes
Your Personal Tour Guide
Ask me questions while you tour the home.