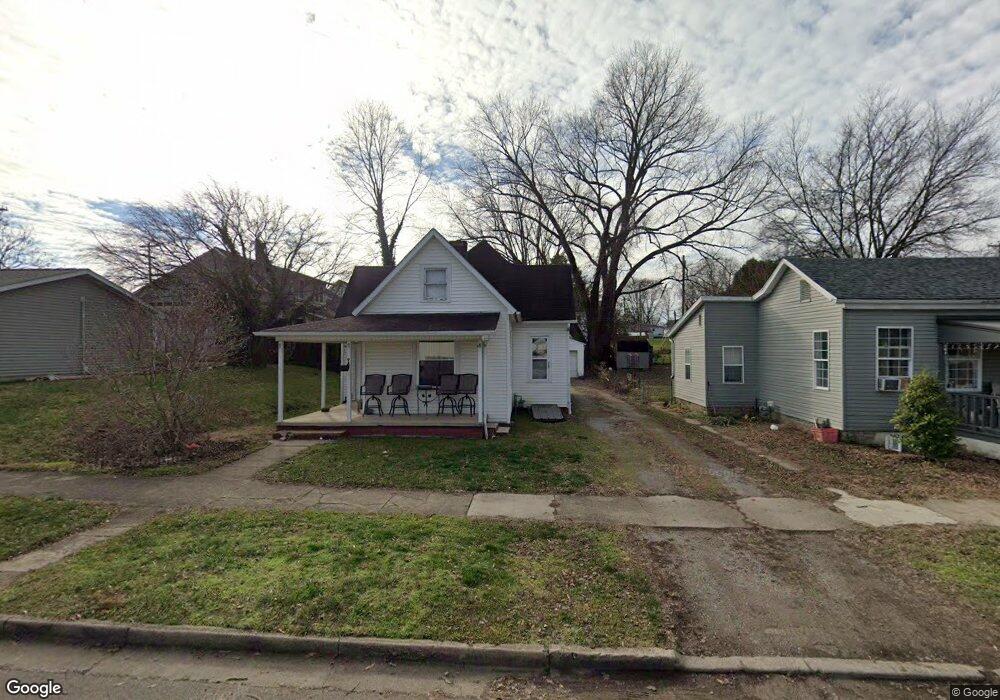
95 W Main St Jackson, OH 45640
Estimated Value: $129,182 - $167,000
2
Beds
1
Bath
1,354
Sq Ft
$114/Sq Ft
Est. Value
About This Home
This home is located at 95 W Main St, Jackson, OH 45640 and is currently estimated at $153,796, approximately $113 per square foot. 95 W Main St is a home located in Jackson County with nearby schools including Jackson High School and Christian Life Academy.
Ownership History
Date
Name
Owned For
Owner Type
Purchase Details
Closed on
Sep 12, 2006
Sold by
Longfellow Layne
Bought by
Jse Investments Inc
Current Estimated Value
Purchase Details
Closed on
Mar 22, 2005
Sold by
Longfellow Opal E
Bought by
Longfellow Layne A
Purchase Details
Closed on
Jan 26, 2005
Sold by
Longfello Layne A
Bought by
Longfellow Opla E
Purchase Details
Closed on
Dec 4, 2002
Sold by
Longfellow Herschel H
Bought by
Longfellow Layne A
Create a Home Valuation Report for This Property
The Home Valuation Report is an in-depth analysis detailing your home's value as well as a comparison with similar homes in the area
Home Values in the Area
Average Home Value in this Area
Purchase History
| Date | Buyer | Sale Price | Title Company |
|---|---|---|---|
| Jse Investments Inc | $65,000 | None Available | |
| Longfellow Layne A | -- | None Available | |
| Longfellow Opla E | -- | None Available | |
| Longfellow Layne A | -- | -- |
Source: Public Records
Tax History
| Year | Tax Paid | Tax Assessment Tax Assessment Total Assessment is a certain percentage of the fair market value that is determined by local assessors to be the total taxable value of land and additions on the property. | Land | Improvement |
|---|---|---|---|---|
| 2025 | $988 | $26,880 | $4,990 | $21,890 |
| 2024 | $997 | $26,880 | $4,990 | $21,890 |
| 2023 | $1,015 | $26,880 | $4,990 | $21,890 |
| 2022 | $1,164 | $22,830 | $4,820 | $18,010 |
| 2021 | $929 | $22,830 | $4,820 | $18,010 |
| 2020 | $921 | $22,830 | $4,820 | $18,010 |
| 2019 | $812 | $19,690 | $4,160 | $15,530 |
| 2018 | $783 | $19,690 | $4,160 | $15,530 |
| 2017 | $978 | $25,650 | $4,160 | $21,490 |
| 2016 | $761 | $19,690 | $4,160 | $15,530 |
| 2015 | $765 | $19,690 | $4,160 | $15,530 |
| 2013 | $735 | $18,960 | $4,160 | $14,800 |
| 2012 | $746 | $18,960 | $4,160 | $14,800 |
Source: Public Records
Map
Nearby Homes
Your Personal Tour Guide
Ask me questions while you tour the home.