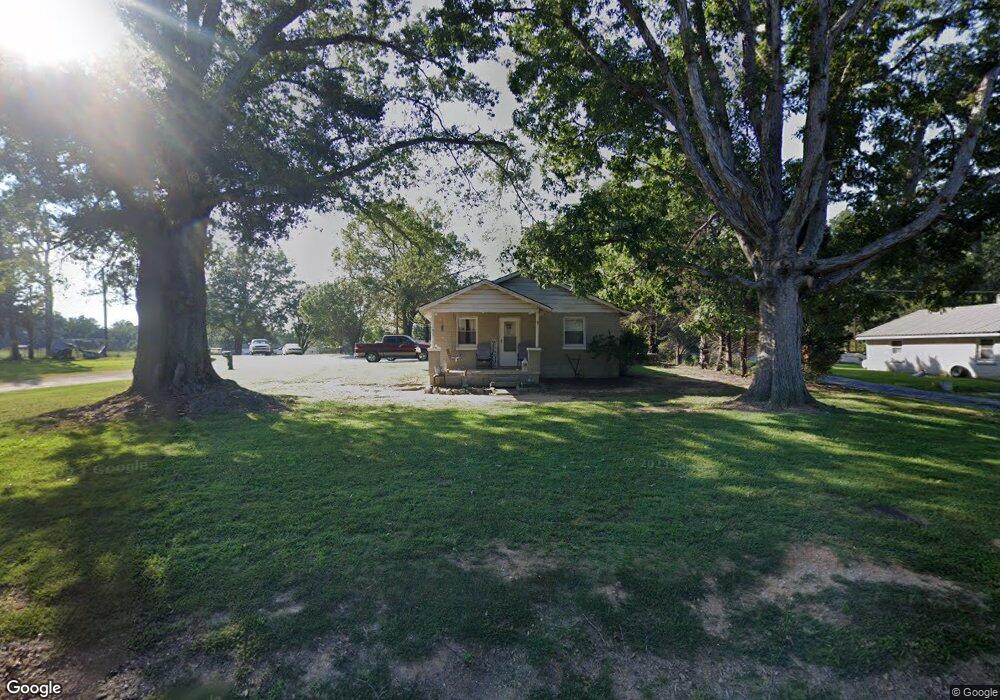
95 Watterson Rd Unit 3 Grover, NC 28073
Estimated Value: $83,581 - $237,000
Studio
--
Bath
1,820
Sq Ft
$100/Sq Ft
Est. Value
About This Home
This home is located at 95 Watterson Rd Unit 3, Grover, NC 28073 and is currently estimated at $182,395, approximately $100 per square foot. 95 Watterson Rd Unit 3 is a home located in Cleveland County with nearby schools including Grover Elementary School, Kings Mountain Middle, and Kings Mountain Intermediate School.
Ownership History
Date
Name
Owned For
Owner Type
Purchase Details
Closed on
Mar 18, 2009
Sold by
Baumgardner Judy and Baumgardner Joseph L
Bought by
Gann Jeanna P and Gann Benjamin
Current Estimated Value
Create a Home Valuation Report for This Property
The Home Valuation Report is an in-depth analysis detailing your home's value as well as a comparison with similar homes in the area
Home Values in the Area
Average Home Value in this Area
Purchase History
| Date | Buyer | Sale Price | Title Company |
|---|---|---|---|
| Gann Jeanna P | -- | None Available |
Source: Public Records
Tax History
| Year | Tax Paid | Tax Assessment Tax Assessment Total Assessment is a certain percentage of the fair market value that is determined by local assessors to be the total taxable value of land and additions on the property. | Land | Improvement |
|---|---|---|---|---|
| 2025 | $119 | $18,729 | $18,095 | $634 |
| 2024 | $99 | $12,472 | $11,511 | $961 |
| 2023 | $99 | $12,472 | $11,511 | $961 |
| 2022 | $99 | $12,472 | $11,511 | $961 |
| 2021 | $607 | $66,532 | $11,511 | $55,021 |
| 2020 | $504 | $58,290 | $10,191 | $48,099 |
| 2019 | $504 | $58,290 | $10,191 | $48,099 |
| 2018 | $503 | $58,290 | $10,191 | $48,099 |
| 2017 | $501 | $58,290 | $10,191 | $48,099 |
| 2016 | $479 | $58,290 | $10,191 | $48,099 |
| 2015 | $552 | $67,559 | $10,191 | $57,368 |
| 2014 | $596 | $67,559 | $10,191 | $57,368 |
Source: Public Records
Map
Nearby Homes
- 164 Blackburn Dr
- 219 Watterson Rd
- 129 Lakeview Dr
- 614 Tribal Rd
- 101 Park Ln
- 304 D S Main St
- 304 C S Main St
- 304 B S Main St
- Holly Springs Plan at Grover Walk
- 304 A S Main St
- 238 Lakeview Dr
- 114 Lakeview Dr
- 00 Mallard Dr
- 0 Mill Creek Rd
- 105 Elm Rd
- 127 Mullinax Dr
- 964 Lavender Rd
- 213 Mullinax Dr
- 1249 Cleveland Ave
- 00 Mill Creek Rd
- 95 Watterson Rd Unit 4
- 101 Watterson Rd
- 103 Watterson Rd Unit 4
- 100 Watterson Rd
- 102 Watterson Rd
- 104 Watterson Rd
- 107 Watterson Rd
- 108 Watterson Rd
- 109 Watterson Rd
- 102 Villa Dr
- 111 Watterson Rd
- 110 Watterson Rd
- 113 Watterson Rd
- 106 Villa Dr
- 146 Waterson Rd
- 115 Watterson Rd
- 112 Villa Dr
- 117 Watterson Rd
- 116 Watterson Rd
- 116 Watterson Rd
Your Personal Tour Guide
Ask me questions while you tour the home.