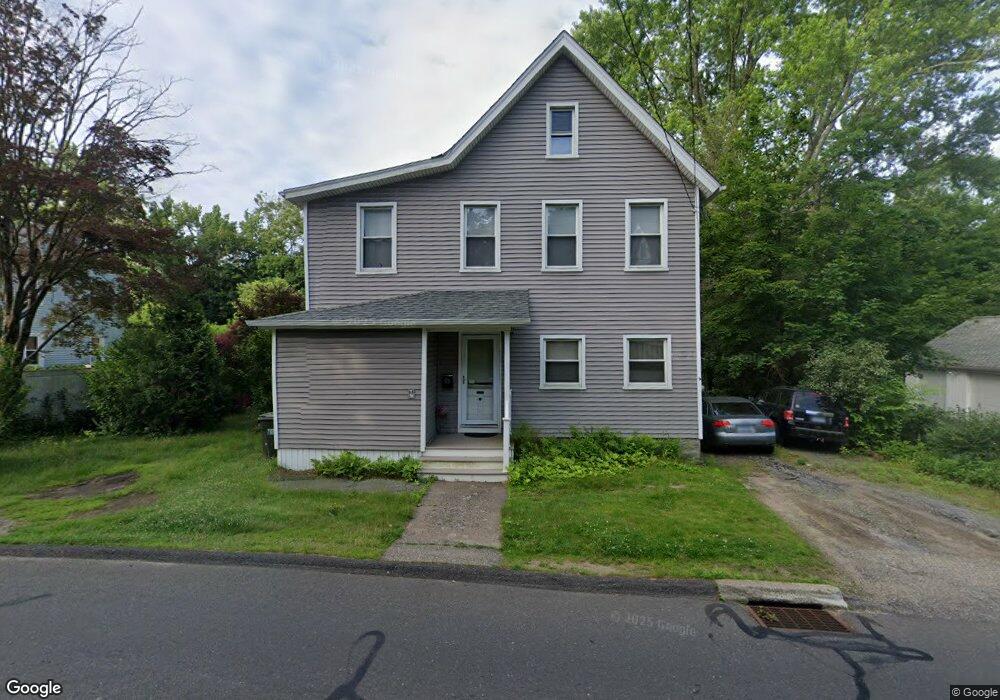
95 West St Seymour, CT 06483
Estimated Value: $293,134 - $407,000
3
Beds
2
Baths
1,636
Sq Ft
$211/Sq Ft
Est. Value
About This Home
This home is located at 95 West St, Seymour, CT 06483 and is currently estimated at $344,534, approximately $210 per square foot. 95 West St is a home located in New Haven County with nearby schools including Bungay Elementary School, Seymour Middle School, and Seymour High School.
Ownership History
Date
Name
Owned For
Owner Type
Purchase Details
Closed on
Jan 11, 2024
Sold by
Tontini Paul A and Tontini Jean M
Bought by
Tontini Daniel
Current Estimated Value
Purchase Details
Closed on
Oct 20, 1992
Sold by
Hullette James
Bought by
Tontini Paul and Tontini Jean
Home Financials for this Owner
Home Financials are based on the most recent Mortgage that was taken out on this home.
Original Mortgage
$68,000
Interest Rate
7.93%
Mortgage Type
Purchase Money Mortgage
Create a Home Valuation Report for This Property
The Home Valuation Report is an in-depth analysis detailing your home's value as well as a comparison with similar homes in the area
Home Values in the Area
Average Home Value in this Area
Purchase History
| Date | Buyer | Sale Price | Title Company |
|---|---|---|---|
| Tontini Daniel | -- | None Available | |
| Tontini Daniel | -- | None Available | |
| Tontini Paul | $80,000 | -- | |
| Tontini Paul | $80,000 | -- |
Source: Public Records
Mortgage History
| Date | Status | Borrower | Loan Amount |
|---|---|---|---|
| Previous Owner | Tontini Paul | $58,000 | |
| Previous Owner | Tontini Paul | $68,000 |
Source: Public Records
Tax History
| Year | Tax Paid | Tax Assessment Tax Assessment Total Assessment is a certain percentage of the fair market value that is determined by local assessors to be the total taxable value of land and additions on the property. | Land | Improvement |
|---|---|---|---|---|
| 2025 | $4,801 | $173,180 | $35,350 | $137,830 |
| 2024 | $5,410 | $146,860 | $30,310 | $116,550 |
| 2023 | $5,284 | $146,860 | $30,310 | $116,550 |
| 2022 | $5,227 | $146,860 | $30,310 | $116,550 |
| 2021 | $5,098 | $146,860 | $30,310 | $116,550 |
| 2020 | $4,425 | $122,920 | $35,630 | $87,290 |
| 2019 | $4,425 | $122,920 | $35,630 | $87,290 |
| 2018 | $4,425 | $122,920 | $35,630 | $87,290 |
| 2017 | $4,425 | $122,920 | $35,630 | $87,290 |
| 2016 | $4,425 | $122,920 | $35,630 | $87,290 |
| 2015 | $4,654 | $134,540 | $39,900 | $94,640 |
| 2014 | $4,580 | $134,540 | $39,900 | $94,640 |
Source: Public Records
Map
Nearby Homes
- 68 New St
- 32 George St
- 17 Grand St
- 11 Oxford Rd
- 122 Derby Ave
- 93 Balance Rock Rd Unit 1
- 73 Micko Dr
- 48 Micko Dr
- 67 Micko Dr
- 71 Micko Dr
- 69 Micko Dr
- 11 Poplar Dr
- 50 Bissell Place
- 79 Balance Rock Rd Unit 12
- 79 Balance Rock Rd Unit 8
- 37-14, 49-1, 79-2, 7 Balance Rock Rd
- 169 Derby Ave
- 75 Balance Rock Rd Unit 20
- 53-55 Maple St
- 26 Union St
Your Personal Tour Guide
Ask me questions while you tour the home.