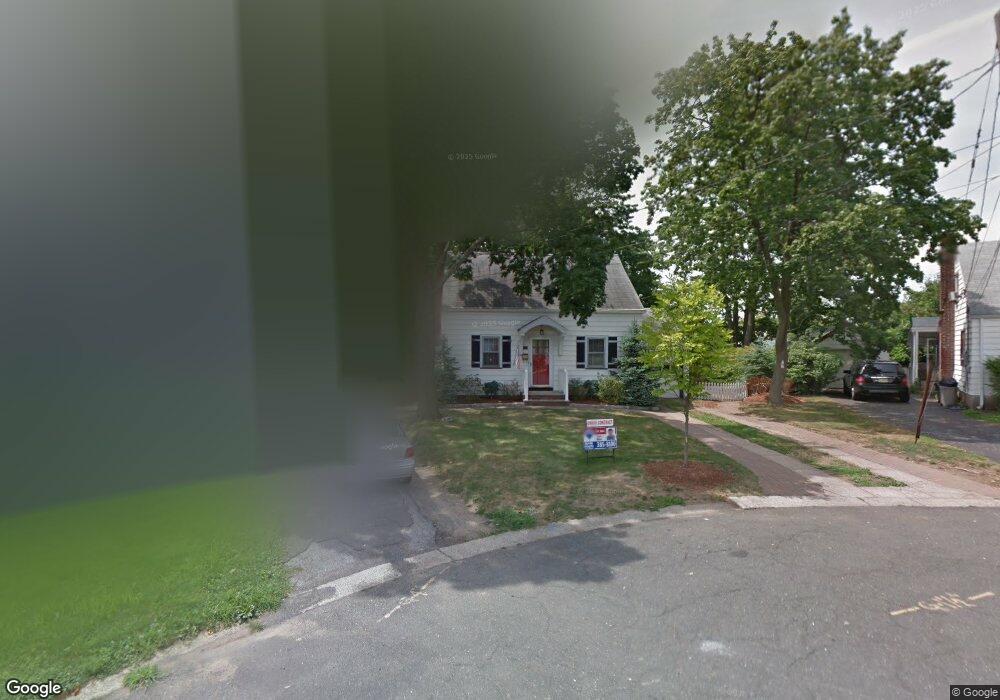
95 Wilkens Dr Dumont, NJ 07628
Estimated Value: $519,000 - $658,000
--
Bed
--
Bath
1,029
Sq Ft
$587/Sq Ft
Est. Value
About This Home
This home is located at 95 Wilkens Dr, Dumont, NJ 07628 and is currently estimated at $603,593, approximately $586 per square foot. 95 Wilkens Dr is a home located in Bergen County with nearby schools including Dumont High School.
Ownership History
Date
Name
Owned For
Owner Type
Purchase Details
Closed on
Aug 9, 2012
Sold by
Kozay Barbara
Bought by
Cogollo Orlando and Gallego Angela
Current Estimated Value
Home Financials for this Owner
Home Financials are based on the most recent Mortgage that was taken out on this home.
Original Mortgage
$240,562
Outstanding Balance
$166,179
Interest Rate
3.61%
Mortgage Type
FHA
Estimated Equity
$437,414
Purchase Details
Closed on
Oct 10, 2000
Bought by
Kozay Barbara
Home Financials for this Owner
Home Financials are based on the most recent Mortgage that was taken out on this home.
Original Mortgage
$64,500
Interest Rate
7.96%
Create a Home Valuation Report for This Property
The Home Valuation Report is an in-depth analysis detailing your home's value as well as a comparison with similar homes in the area
Home Values in the Area
Average Home Value in this Area
Purchase History
| Date | Buyer | Sale Price | Title Company |
|---|---|---|---|
| Cogollo Orlando | $245,000 | -- | |
| Kozay Barbara | -- | -- | |
| Kozay Barbara | -- | -- |
Source: Public Records
Mortgage History
| Date | Status | Borrower | Loan Amount |
|---|---|---|---|
| Open | Cogollo Orlando | $240,562 | |
| Previous Owner | Kozay Barbara | $64,500 |
Source: Public Records
Tax History Compared to Growth
Tax History
| Year | Tax Paid | Tax Assessment Tax Assessment Total Assessment is a certain percentage of the fair market value that is determined by local assessors to be the total taxable value of land and additions on the property. | Land | Improvement |
|---|---|---|---|---|
| 2025 | $12,532 | $539,600 | $331,600 | $208,000 |
| 2024 | $12,224 | $308,300 | $212,600 | $95,700 |
| 2023 | $11,971 | $308,300 | $212,600 | $95,700 |
| 2022 | $11,971 | $308,300 | $212,600 | $95,700 |
| 2021 | $11,913 | $308,300 | $212,600 | $95,700 |
| 2020 | $11,589 | $308,300 | $212,600 | $95,700 |
| 2019 | $11,312 | $308,300 | $212,600 | $95,700 |
| 2018 | $11,080 | $308,300 | $212,600 | $95,700 |
| 2017 | $10,868 | $308,300 | $212,600 | $95,700 |
| 2016 | $10,615 | $308,300 | $212,600 | $95,700 |
| 2015 | $10,371 | $308,300 | $212,600 | $95,700 |
| 2014 | $10,168 | $308,300 | $212,600 | $95,700 |
Source: Public Records
Map
Nearby Homes