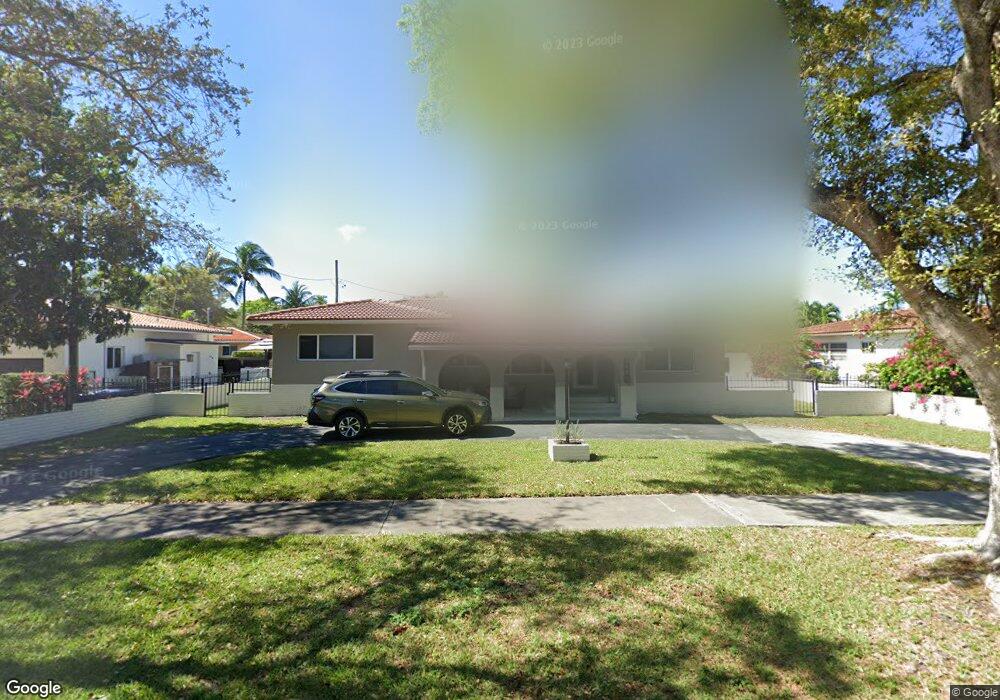
950 Apache St Miami Springs, FL 33166
Estimated Value: $638,000 - $895,000
3
Beds
2
Baths
1,951
Sq Ft
$385/Sq Ft
Est. Value
About This Home
This home is located at 950 Apache St, Miami Springs, FL 33166 and is currently estimated at $751,959, approximately $385 per square foot. 950 Apache St is a home located in Miami-Dade County with nearby schools including Springview Elementary School, Miami Springs Middle School, and Miami Springs Senior High School.
Ownership History
Date
Name
Owned For
Owner Type
Purchase Details
Closed on
Dec 30, 2020
Sold by
Robertson Debra J and Yates Kathleen R
Bought by
Hill Robert C and Nickerson Elizabeth M
Current Estimated Value
Home Financials for this Owner
Home Financials are based on the most recent Mortgage that was taken out on this home.
Original Mortgage
$308,000
Outstanding Balance
$274,891
Interest Rate
2.71%
Mortgage Type
New Conventional
Estimated Equity
$477,068
Purchase Details
Closed on
Oct 16, 2002
Sold by
Robertson Patricia N
Bought by
Robertson Trust
Create a Home Valuation Report for This Property
The Home Valuation Report is an in-depth analysis detailing your home's value as well as a comparison with similar homes in the area
Home Values in the Area
Average Home Value in this Area
Purchase History
| Date | Buyer | Sale Price | Title Company |
|---|---|---|---|
| Hill Robert C | $433,000 | Attorney | |
| Robertson Trust | -- | -- |
Source: Public Records
Mortgage History
| Date | Status | Borrower | Loan Amount |
|---|---|---|---|
| Open | Hill Robert C | $308,000 |
Source: Public Records
Tax History Compared to Growth
Tax History
| Year | Tax Paid | Tax Assessment Tax Assessment Total Assessment is a certain percentage of the fair market value that is determined by local assessors to be the total taxable value of land and additions on the property. | Land | Improvement |
|---|---|---|---|---|
| 2025 | $8,152 | $387,842 | -- | -- |
| 2024 | $7,901 | $376,912 | -- | -- |
| 2023 | $7,901 | $365,934 | $0 | $0 |
| 2022 | $7,604 | $355,276 | $0 | $0 |
| 2021 | $7,607 | $344,929 | $199,692 | $145,237 |
| 2020 | $3,717 | $174,808 | $0 | $0 |
| 2019 | $3,625 | $170,878 | $0 | $0 |
| 2018 | $3,475 | $167,692 | $0 | $0 |
| 2017 | $3,432 | $164,243 | $0 | $0 |
| 2016 | $3,415 | $160,865 | $0 | $0 |
| 2015 | $3,436 | $159,747 | $0 | $0 |
| 2014 | $3,462 | $158,480 | $0 | $0 |
Source: Public Records
Map
Nearby Homes