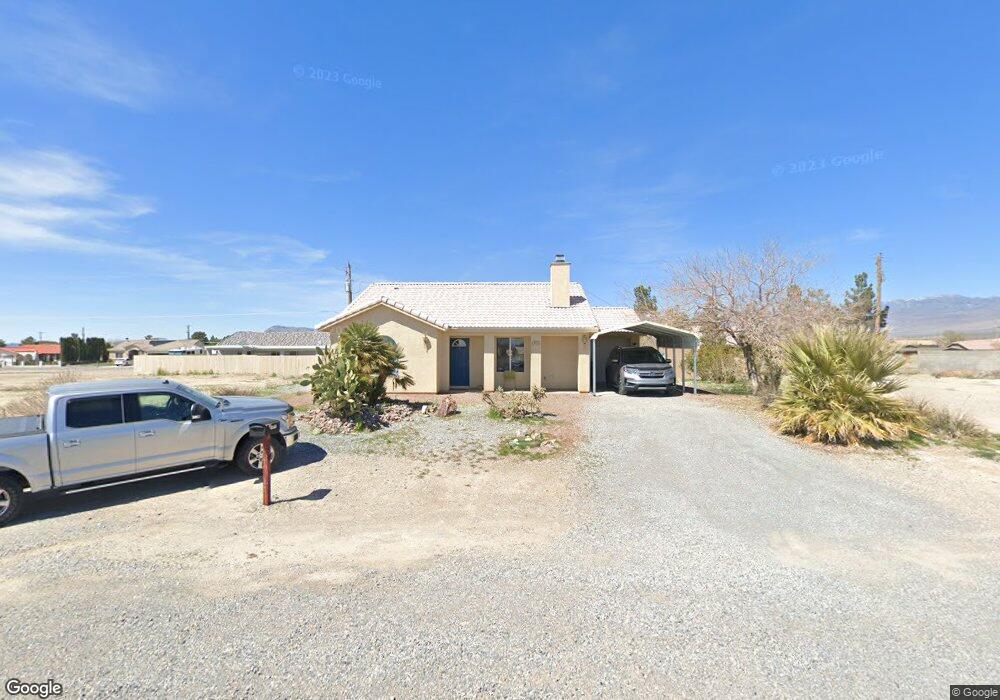
950 Enchanted Mesa St Pahrump, NV 89048
Estimated Value: $217,000 - $278,000
--
Bed
--
Bath
1,063
Sq Ft
$227/Sq Ft
Est. Value
About This Home
This home is located at 950 Enchanted Mesa St, Pahrump, NV 89048 and is currently estimated at $241,745, approximately $227 per square foot. 950 Enchanted Mesa St is a home located in Nye County with nearby schools including J.G. Johnson Elementary School, Rosemary Clarke Middle School, and Pahrump Valley High School.
Ownership History
Date
Name
Owned For
Owner Type
Purchase Details
Closed on
Sep 20, 2023
Sold by
Rutherford Cynthia
Bought by
Cynthia May Rutherford Trust and Rutherford
Current Estimated Value
Purchase Details
Closed on
Feb 2, 2018
Sold by
Davis Mark and Davis Loretta
Bought by
Rutherford Cynthia
Purchase Details
Closed on
Nov 27, 2013
Sold by
Claude Roger L and Claude Linda M
Bought by
Davis Mark and Davis Loretta
Purchase Details
Closed on
Apr 30, 2013
Sold by
Hull Nona Marie
Bought by
Claude Family Trust
Purchase Details
Closed on
Sep 7, 2011
Sold by
Hull Nona M
Bought by
Hull Nona Marie and The Nona Marie Hull Family Trust
Purchase Details
Closed on
Dec 8, 2010
Sold by
Fortado Mark E
Bought by
Hull Nona M
Purchase Details
Closed on
Dec 28, 2006
Sold by
Anglemyer Warren E and Anglemyer Frances E
Bought by
Fortado Mark E
Create a Home Valuation Report for This Property
The Home Valuation Report is an in-depth analysis detailing your home's value as well as a comparison with similar homes in the area
Home Values in the Area
Average Home Value in this Area
Purchase History
| Date | Buyer | Sale Price | Title Company |
|---|---|---|---|
| Cynthia May Rutherford Trust | -- | None Listed On Document | |
| Rutherford Cynthia | -- | None Available | |
| Rutherford Cynthia | $135,000 | Sierra Settlement Of Nevada | |
| Davis Mark | $80,000 | Fidelity National Tit | |
| Davis Mark | $80,000 | Fidelity National Title | |
| Davis Mark | $80,000 | Fidelity National Title | |
| Claude Family Trust | -- | None Available | |
| Hull Nona Marie | -- | None Available | |
| Hull Nona M | $82,000 | North American Title Company | |
| Fortado Mark E | $30,000 | Chicago Title |
Source: Public Records
Tax History Compared to Growth
Tax History
| Year | Tax Paid | Tax Assessment Tax Assessment Total Assessment is a certain percentage of the fair market value that is determined by local assessors to be the total taxable value of land and additions on the property. | Land | Improvement |
|---|---|---|---|---|
| 2025 | $1,185 | $42,290 | $2,370 | $39,920 |
| 2024 | $1,185 | $43,039 | $2,370 | $40,669 |
| 2023 | $1,185 | $39,875 | $2,370 | $37,505 |
| 2022 | $1,018 | $36,197 | $2,370 | $33,827 |
| 2021 | $948 | $34,400 | $1,896 | $32,504 |
| 2020 | $911 | $34,239 | $1,896 | $32,343 |
| 2019 | $853 | $40,970 | $1,896 | $39,074 |
| 2018 | $816 | $39,297 | $1,517 | $37,780 |
| 2017 | $785 | $31,599 | $1,517 | $30,082 |
| 2016 | $766 | $21,479 | $1,517 | $19,962 |
| 2015 | $744 | $19,911 | $1,517 | $18,394 |
| 2014 | $722 | $21,489 | $1,517 | $19,972 |
Source: Public Records
Map
Nearby Homes
- 1611 Enchanted Mesa St
- 941 Enchanted Mesa St
- 810 Enchanted Mesa St
- 1140 Grant St
- 960 E Honeysuckle St
- 1561 S Highland Ave
- 1381 S Saddle Ct
- 660 E San Lorenzo St
- 1171 Daytona St
- 570 E Tacoma Rd
- 1070 Ibis St
- 781 Bourbon St Unit 1
- 1040 Karen Ct
- 761 Bourbon St Unit D3
- 761 Bourbon St Unit 5
- 1080 Marne Ct
- 1100 Karen Ct
- 721 Bourbon St Unit F2
- 701 Bourbon St Unit G3
- 1050 Hiawatha St
- 961 E Mount Charleston Dr N
- 3500 Mount Charleston Dr
- 941 E Mount Charleston Dr N
- 980 Enchanted Mesa St
- 991 Enchanted Mesa St
- 900 Enchanted Mesa St
- 3525 Mount Charleston Dr Unit 7
- 980 E Mount Charleston Dr N
- 950 E Mount Charleston Dr N
- 3584 Mount Charleston Dr
- 3485 Mount Charleston Dr
- 1001 E Mount Charleston Dr S
- 1121 Enchanted Mesa St
- 1240 Enchanted Mesa St
- 1370 Enchanted Mesa St
- 1680 Enchanted Mesa St
- 1840 Enchanted Mesa St
- 1361 Enchanted Mesa St
- 1650 Enchanted Mesa St
- 1380 Enchanted Mesa St