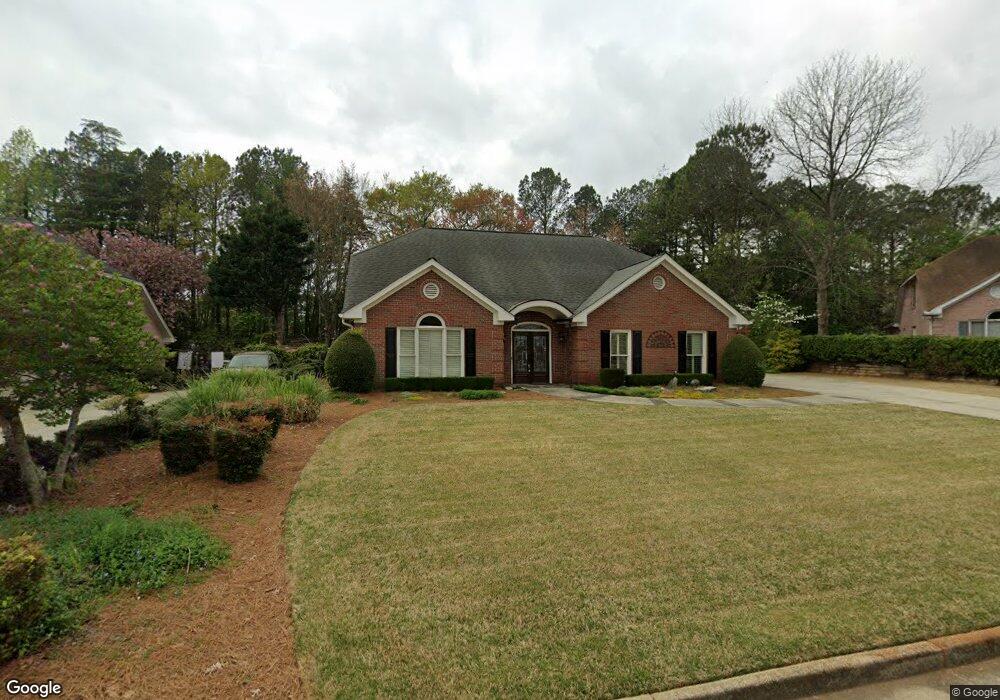
950 Knoll Crest Ct Alpharetta, GA 30004
Estimated Value: $658,000 - $735,639
3
Beds
3
Baths
2,691
Sq Ft
$258/Sq Ft
Est. Value
About This Home
This home is located at 950 Knoll Crest Ct, Alpharetta, GA 30004 and is currently estimated at $694,410, approximately $258 per square foot. 950 Knoll Crest Ct is a home located in Fulton County with nearby schools including Crabapple Crossing Elementary School, Northwestern Middle School, and Milton High School.
Ownership History
Date
Name
Owned For
Owner Type
Purchase Details
Closed on
Sep 28, 2010
Sold by
Rollins R & M J F Trust
Bought by
Alkonis Martha A
Current Estimated Value
Purchase Details
Closed on
Mar 22, 2007
Sold by
Rollins Richard L and Rollins Melba R
Bought by
Rollins Family Trust
Home Financials for this Owner
Home Financials are based on the most recent Mortgage that was taken out on this home.
Original Mortgage
$252,000
Interest Rate
6.27%
Mortgage Type
New Conventional
Purchase Details
Closed on
May 6, 1994
Sold by
Fairgreen Capital Lp
Bought by
Burns John H Barbara J
Home Financials for this Owner
Home Financials are based on the most recent Mortgage that was taken out on this home.
Original Mortgage
$100,000
Interest Rate
8.07%
Create a Home Valuation Report for This Property
The Home Valuation Report is an in-depth analysis detailing your home's value as well as a comparison with similar homes in the area
Home Values in the Area
Average Home Value in this Area
Purchase History
| Date | Buyer | Sale Price | Title Company |
|---|---|---|---|
| Alkonis Martha A | $245,000 | -- | |
| Rollins Family Trust | -- | -- | |
| Rollins Richard L | $315,000 | -- | |
| Burns John H Barbara J | $209,100 | -- |
Source: Public Records
Mortgage History
| Date | Status | Borrower | Loan Amount |
|---|---|---|---|
| Previous Owner | Rollins Richard L | $252,000 | |
| Previous Owner | Burns John H Barbara J | $100,000 |
Source: Public Records
Tax History Compared to Growth
Tax History
| Year | Tax Paid | Tax Assessment Tax Assessment Total Assessment is a certain percentage of the fair market value that is determined by local assessors to be the total taxable value of land and additions on the property. | Land | Improvement |
|---|---|---|---|---|
| 2025 | $692 | $248,000 | $65,800 | $182,200 |
| 2023 | $7,201 | $248,000 | $65,800 | $182,200 |
| 2022 | $1,915 | $200,520 | $41,520 | $159,000 |
| 2021 | $2,438 | $176,040 | $35,360 | $140,680 |
| 2020 | $2,416 | $174,000 | $34,960 | $139,040 |
| 2019 | $572 | $170,880 | $34,320 | $136,560 |
| 2018 | $1,696 | $149,280 | $27,760 | $121,520 |
| 2017 | $2,022 | $119,040 | $26,080 | $92,960 |
| 2016 | $2,015 | $119,040 | $26,080 | $92,960 |
| 2015 | $2,358 | $119,040 | $26,080 | $92,960 |
| 2014 | $2,017 | $119,040 | $26,080 | $92,960 |
Source: Public Records
Map
Nearby Homes
- 666 Abbey Ct
- 1565 Parkside Dr
- 285 N Farm Dr
- 13125 Morningpark Cir
- 216 Lask Ln
- 580 Stillhouse Ln Unit 2
- 406 Sweet Apple Cir
- 233 Lask Ln
- 237 Lask Ln
- 245 Lask Ln
- 640 Mae Ln
- 249 Lask Ln
- 113 Quinn Way
- 12440 Brookhill Crossing Ln
- 290 Rucker Rd
- 257 Lask Ln
- 12857 Waterside Dr
- 13025 Morningpark Cir
- 13015 Morningpark Cir Unit 1
- 127 Quinn Way
- 940 Knoll Crest Ct
- 960 Knoll Crest Ct
- 930 Knoll Crest Ct Unit 4
- 0 Knoll Crest Ct Unit 7361576
- 965 Knoll Crest Ct Unit 4
- 945 Knoll Crest Ct
- 935 Knoll Crest Ct
- 955 Knoll Crest Ct
- 920 Knoll Crest Ct
- 925 Knoll Crest Ct
- 730 Lewiston Ct
- 720 Lewiston Ct Unit 4
- 740 Lewiston Ct
- 915 Knoll Crest Ct
- 910 Knoll Crest Ct
- 710 Lewiston Ct
- 750 Lewiston Ct
- 905 Knoll Crest Ct Unit 4
- 900 Knoll Crest Ct
- 0 Lewiston Ct Unit 8350288