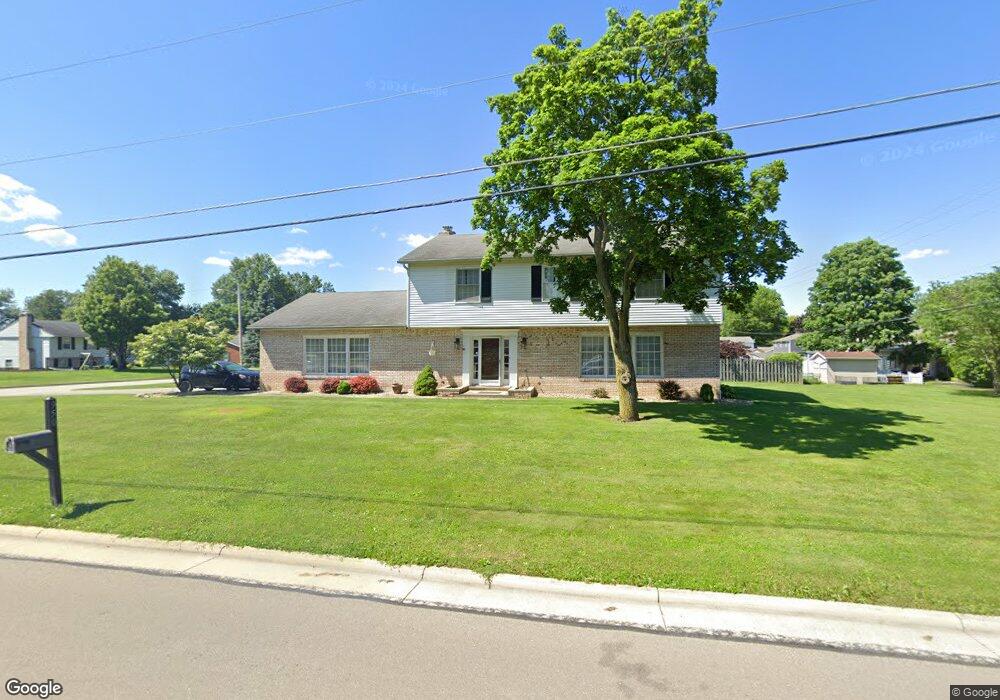
950 Laura Ave Bucyrus, OH 44820
Estimated Value: $268,348 - $329,000
4
Beds
4
Baths
2,400
Sq Ft
$121/Sq Ft
Est. Value
About This Home
This home is located at 950 Laura Ave, Bucyrus, OH 44820 and is currently estimated at $289,837, approximately $120 per square foot. 950 Laura Ave is a home located in Crawford County with nearby schools including Bucyrus Elementary School, Bucyrus Secondary School, and Wayside Christian School.
Ownership History
Date
Name
Owned For
Owner Type
Purchase Details
Closed on
May 22, 2018
Sold by
Holbrook Jennifer M and Holbrook Dallas R
Bought by
Piatt Chase M and Crawford Kennedy J
Current Estimated Value
Home Financials for this Owner
Home Financials are based on the most recent Mortgage that was taken out on this home.
Original Mortgage
$146,464
Outstanding Balance
$126,110
Interest Rate
4.4%
Mortgage Type
New Conventional
Estimated Equity
$163,727
Purchase Details
Closed on
Dec 11, 2014
Sold by
Karns Cindy L and Karns Jeffery M
Bought by
Holbrook Jennifer M and Holbrook Dallas R
Home Financials for this Owner
Home Financials are based on the most recent Mortgage that was taken out on this home.
Original Mortgage
$120,673
Interest Rate
4.25%
Mortgage Type
FHA
Purchase Details
Closed on
Apr 6, 2010
Sold by
Pfaff Robert S and Pfaff Phyllis A
Bought by
Karns Cindy L
Create a Home Valuation Report for This Property
The Home Valuation Report is an in-depth analysis detailing your home's value as well as a comparison with similar homes in the area
Home Values in the Area
Average Home Value in this Area
Purchase History
| Date | Buyer | Sale Price | Title Company |
|---|---|---|---|
| Piatt Chase M | $144,000 | Acs Title Bucyrus | |
| Holbrook Jennifer M | $47,900 | Southern Title | |
| Karns Cindy L | $125 | -- |
Source: Public Records
Mortgage History
| Date | Status | Borrower | Loan Amount |
|---|---|---|---|
| Open | Piatt Chase M | $146,464 | |
| Previous Owner | Holbrook Jennifer M | $120,673 |
Source: Public Records
Tax History Compared to Growth
Tax History
| Year | Tax Paid | Tax Assessment Tax Assessment Total Assessment is a certain percentage of the fair market value that is determined by local assessors to be the total taxable value of land and additions on the property. | Land | Improvement |
|---|---|---|---|---|
| 2024 | $3,861 | $85,580 | $9,650 | $75,930 |
| 2023 | $3,861 | $62,970 | $7,420 | $55,550 |
| 2022 | $3,359 | $62,970 | $7,420 | $55,550 |
| 2021 | $3,352 | $62,970 | $7,420 | $55,550 |
| 2020 | $2,815 | $50,120 | $7,420 | $42,700 |
| 2019 | $2,878 | $50,120 | $7,420 | $42,700 |
| 2018 | $2,802 | $50,120 | $7,420 | $42,700 |
| 2017 | $2,645 | $45,860 | $7,420 | $38,440 |
| 2016 | $2,562 | $45,860 | $7,420 | $38,440 |
| 2015 | $2,526 | $45,860 | $7,420 | $38,440 |
| 2014 | $2,586 | $45,860 | $7,420 | $38,440 |
| 2013 | $2,586 | $45,860 | $7,420 | $38,440 |
Source: Public Records
Map
Nearby Homes
- 0 Lynne Ave
- 1145 Lynne Ave
- 1315 Lynne Ave
- 1149 Farmview Dr
- 1112 Hillcrest Dr
- 1123 Hillcrest Dr
- 1555 Rosedale Ave
- 452 Pleasant Ln
- 2440 Wyandot Rd
- 130 Brentwood St
- 275 Brentwood St
- 900 S Spring St
- 1211 S Sandusky Ave
- 1021 S Sandusky Ave
- 325 W Liberty St
- 708 S Sandusky Ave
- 318 Charlotte St
- 317 S Spring St
- 2273 Kerstetter Rd
- 316 W Warren St
- 1160 Lynne Ave
- 930 Laura Ave
- 945 Laura Ave
- 930 Laura (P)
- 1163 Rosedale Ave
- 1000 Laura Ave
- 1140 Lynne Ave
- 935 Laura Ave
- 1147 Lynne Ave
- 1205 Lynne Ave
- 1220 Lynne Ave
- 1153 Rosedale Ave
- 1120 Lynne Ave
- 1182 Rosedale (P)
- 1185 Rosedale Ave
- 1215 Lynne Ave
- 1143 Rosedale Ave
- 1022 Laura Ave
- 1172 Rosedale Ave
- 1240 Lynne Ave