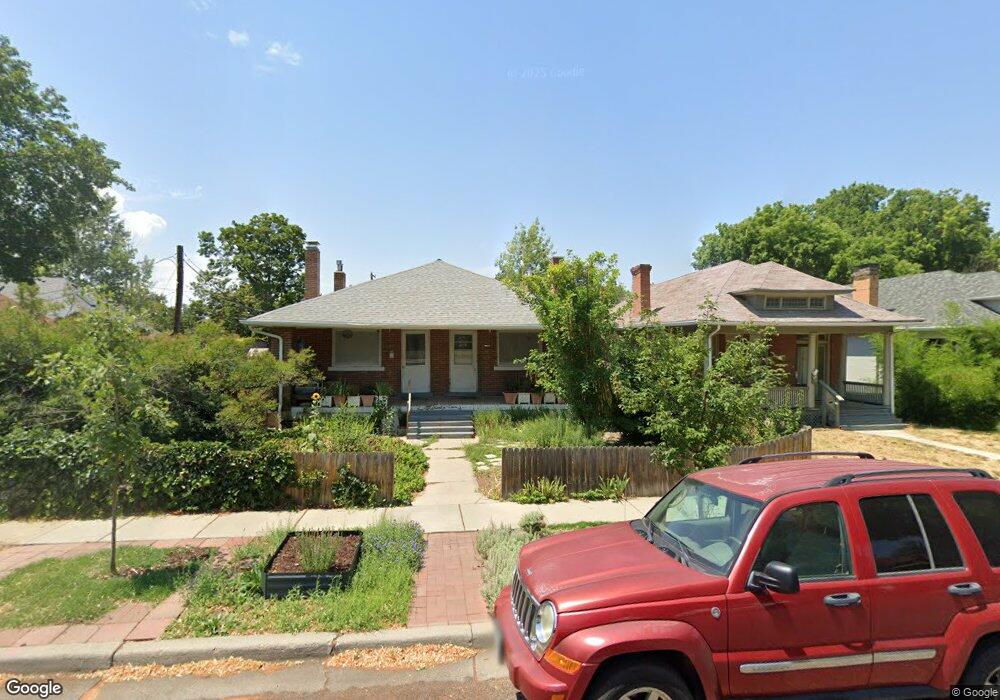
950 S 1000 E Unit 952 Salt Lake City, UT 84105
East Central NeighborhoodEstimated Value: $636,692 - $1,144,000
5
Beds
2
Baths
2,772
Sq Ft
$279/Sq Ft
Est. Value
About This Home
This home is located at 950 S 1000 E Unit 952, Salt Lake City, UT 84105 and is currently estimated at $772,923, approximately $278 per square foot. 950 S 1000 E Unit 952 is a home located in Salt Lake County with nearby schools including Emerson School, Clayton Middle School, and East High School.
Ownership History
Date
Name
Owned For
Owner Type
Purchase Details
Closed on
Dec 13, 1996
Sold by
Holland John M
Bought by
Grundvig G Scott and Grundvig David Lee
Current Estimated Value
Home Financials for this Owner
Home Financials are based on the most recent Mortgage that was taken out on this home.
Original Mortgage
$141,616
Interest Rate
7.76%
Mortgage Type
FHA
Create a Home Valuation Report for This Property
The Home Valuation Report is an in-depth analysis detailing your home's value as well as a comparison with similar homes in the area
Home Values in the Area
Average Home Value in this Area
Purchase History
| Date | Buyer | Sale Price | Title Company |
|---|---|---|---|
| Grundvig G Scott | -- | -- |
Source: Public Records
Mortgage History
| Date | Status | Borrower | Loan Amount |
|---|---|---|---|
| Previous Owner | Grundvig G Scott | $141,616 |
Source: Public Records
Tax History Compared to Growth
Tax History
| Year | Tax Paid | Tax Assessment Tax Assessment Total Assessment is a certain percentage of the fair market value that is determined by local assessors to be the total taxable value of land and additions on the property. | Land | Improvement |
|---|---|---|---|---|
| 2025 | -- | $528,600 | $267,800 | $260,800 |
| 2024 | -- | $529,100 | $253,400 | $275,700 |
| 2023 | -- | $344,700 | $243,700 | $101,000 |
| 2022 | $0 | $355,100 | $238,900 | $116,200 |
| 2021 | $2,273 | $288,500 | $185,300 | $103,200 |
| 2020 | $1,823 | $271,100 | $183,300 | $87,800 |
| 2019 | $1,928 | $269,700 | $172,600 | $97,100 |
| 2018 | $0 | $222,100 | $172,600 | $49,500 |
| 2017 | $1,741 | $222,200 | $172,600 | $49,600 |
| 2016 | $1,703 | $206,400 | $127,200 | $79,200 |
| 2015 | $1,938 | $222,600 | $131,100 | $91,500 |
| 2014 | -- | $211,200 | $128,500 | $82,700 |
Source: Public Records
Map
Nearby Homes
- 981 Belmont Ave
- 938 S 1000 E
- 985 Belmont Ave
- 975 Belmont Ave
- 975 E Belmont Ave
- 936 S 1000 E
- 971 Belmont Ave
- 971 E Belmont Ave
- 1003 E Belmont Ave
- 932 S 1000 E
- 1003 Belmont Ave
- 969 Belmont Ave
- 1007 Belmont Ave
- 947 S 1000 E
- 943 S 1000 E
- 924 S 1000 E
- 949 S Lincoln St
- 949 Lincoln St
- 943 Lincoln St
- 943 S Lincoln St