950 Scenic Hwy Bourne, MA 2532
Estimated Value: $644,000 - $1,475,947
3
Beds
4
Baths
4,310
Sq Ft
$266/Sq Ft
Est. Value
About This Home
This home is located at 950 Scenic Hwy, Bourne, MA 2532 and is currently estimated at $1,146,987, approximately $266 per square foot. 950 Scenic Hwy is a home located in Barnstable County with nearby schools including Bourne High School, Bridgeview Montessori School, and New Testament Christian School.
Ownership History
Date
Name
Owned For
Owner Type
Purchase Details
Closed on
Apr 29, 2020
Sold by
Robery Wendell
Bought by
Robery Ret
Current Estimated Value
Purchase Details
Closed on
Mar 28, 2018
Sold by
Seton Rt
Bought by
Robery Ernest W
Purchase Details
Closed on
Jun 19, 2008
Sold by
Vliet Michelle A
Bought by
Seton Rt
Purchase Details
Closed on
May 6, 2005
Sold by
Seton Rt
Bought by
Vliet Michelle A
Purchase Details
Closed on
May 14, 1999
Sold by
Kristephie T
Bought by
Vliet Michele
Home Financials for this Owner
Home Financials are based on the most recent Mortgage that was taken out on this home.
Original Mortgage
$215,000
Interest Rate
6.92%
Mortgage Type
Purchase Money Mortgage
Purchase Details
Closed on
Mar 22, 1994
Sold by
Kristephie T
Bought by
Sweeney Joseph E and Sweeney Lorraine A
Create a Home Valuation Report for This Property
The Home Valuation Report is an in-depth analysis detailing your home's value as well as a comparison with similar homes in the area
Home Values in the Area
Average Home Value in this Area
Purchase History
| Date | Buyer | Sale Price | Title Company |
|---|---|---|---|
| Robery Ret | -- | None Available | |
| Robery Ernest W | $775,000 | -- | |
| Seton Rt | -- | -- | |
| Vliet Michelle A | -- | -- | |
| Vliet Michele | $390,000 | -- | |
| Sweeney Joseph E | $11,000 | -- |
Source: Public Records
Mortgage History
| Date | Status | Borrower | Loan Amount |
|---|---|---|---|
| Previous Owner | Sweeney Joseph E | $288,000 | |
| Previous Owner | Sweeney Joseph E | $285,000 | |
| Previous Owner | Sweeney Joseph E | $50,000 | |
| Previous Owner | Sweeney Joseph E | $215,000 |
Source: Public Records
Tax History Compared to Growth
Tax History
| Year | Tax Paid | Tax Assessment Tax Assessment Total Assessment is a certain percentage of the fair market value that is determined by local assessors to be the total taxable value of land and additions on the property. | Land | Improvement |
|---|---|---|---|---|
| 2025 | $9,986 | $1,278,600 | $432,300 | $846,300 |
| 2024 | $9,241 | $1,152,200 | $411,700 | $740,500 |
| 2023 | $9,028 | $1,024,700 | $364,400 | $660,300 |
| 2022 | $8,569 | $849,300 | $322,400 | $526,900 |
| 2021 | $8,347 | $775,000 | $293,400 | $481,600 |
| 2020 | $8,152 | $759,000 | $290,600 | $468,400 |
| 2019 | $9,079 | $863,800 | $290,600 | $573,200 |
| 2018 | $8,678 | $823,300 | $276,800 | $546,500 |
| 2017 | $7,901 | $767,100 | $274,200 | $492,900 |
| 2016 | $7,425 | $730,800 | $274,200 | $456,600 |
| 2015 | $7,359 | $730,800 | $274,200 | $456,600 |
Source: Public Records
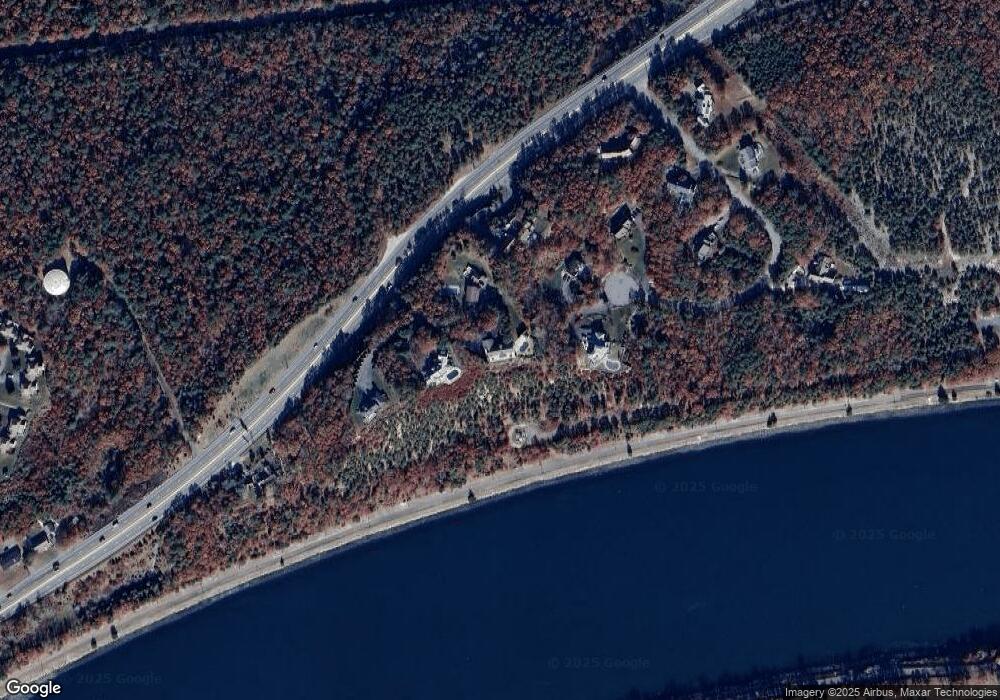
Map
Nearby Homes
- 6 Brigantine Passage Dr
- 4 Bittersweet Ln Unit 4
- 4 Dogwood Rd Unit 4
- 2 Dogwood Rd
- 6 Louis Ave
- 4 Dogwood Rd Unit H
- 2 Dogwood Rd Unit 2
- 33 Buzzards Bay Ave
- 10 Homestead Rd
- 4 Fieldwood Dr
- 4 Fieldwood Dr
- 51 Commonwealth Ave
- 51 Commonwealth Ave
- 20 Fieldwood Dr
- 16 Ocean Pines Dr Unit B
- 18 Ocean Pines Dr Unit A
- 18 Ocean Pines Dr Unit B
- 215 Roxy Cahoon Rd
- 21 Hillside Rd
- 0 State Rd
- 950 Scenic Highway Winter
- 950 Scenic Highway Weekly
- 950 Scenic Highway Weekly
- 950 Scenic Hwy
- 940 Scenic Route 6e Rd
- 940 Scenic Hwy
- 940 Scenic Hwy
- 952 Scenic Hwy
- 952 Scenic Hwy
- 10 Brigantine Passage Dr
- 10 Brigatine Passage Dr
- 9 Brigantine Passage Dr
- 9 Brigatine Passage Dr
- 960 Scenic Hwy
- 930 Scenic Route 6e Rd
- 930 Scenic Hwy
- 930 Scenic Hwy
- 8 Brigantine Passage Dr
- 950 Scenic
- 2 Brigantine Passage Dr