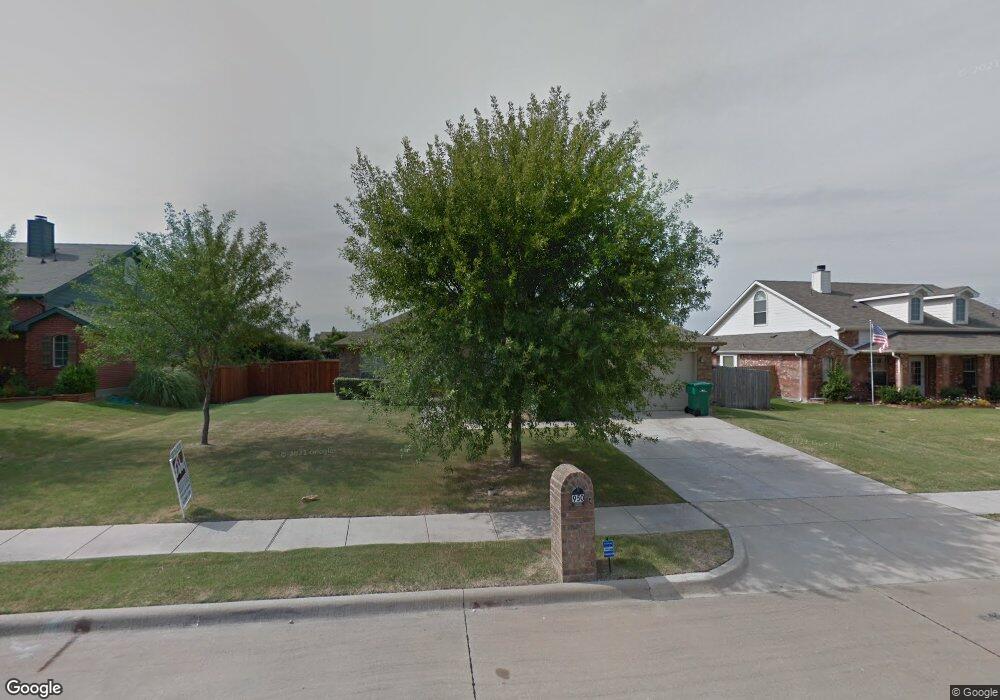
950 W Cedar St Celina, TX 75009
Estimated Value: $402,310 - $472,000
3
Beds
2
Baths
1,962
Sq Ft
$222/Sq Ft
Est. Value
About This Home
This home is located at 950 W Cedar St, Celina, TX 75009 and is currently estimated at $435,578, approximately $222 per square foot. 950 W Cedar St is a home located in Collin County with nearby schools including Celina Primary School, Marcy B. Lykins Elementary School, and Moore Middle School.
Ownership History
Date
Name
Owned For
Owner Type
Purchase Details
Closed on
Oct 29, 2013
Sold by
Stevens Barbara S
Bought by
Torres Marco P and Torres Ana Y
Current Estimated Value
Home Financials for this Owner
Home Financials are based on the most recent Mortgage that was taken out on this home.
Original Mortgage
$133,000
Outstanding Balance
$100,469
Interest Rate
4.56%
Mortgage Type
New Conventional
Estimated Equity
$335,109
Purchase Details
Closed on
May 6, 2009
Sold by
Stevens Edward M and Yates Daisye
Bought by
Stevens Edward M and Stevens Barbara S
Purchase Details
Closed on
Aug 19, 2004
Sold by
Choice Homes Inc
Bought by
Stevens Edward M and Stevens Opal Murphy
Purchase Details
Closed on
May 11, 2004
Sold by
Cottonwood Joint Venture
Bought by
Choice Homes Inc
Create a Home Valuation Report for This Property
The Home Valuation Report is an in-depth analysis detailing your home's value as well as a comparison with similar homes in the area
Home Values in the Area
Average Home Value in this Area
Purchase History
| Date | Buyer | Sale Price | Title Company |
|---|---|---|---|
| Torres Marco P | -- | Fidelity National | |
| Stevens Edward M | -- | None Available | |
| Stevens Edward M | -- | Atc | |
| Choice Homes Inc | -- | American Title |
Source: Public Records
Mortgage History
| Date | Status | Borrower | Loan Amount |
|---|---|---|---|
| Open | Torres Marco P | $133,000 |
Source: Public Records
Tax History Compared to Growth
Tax History
| Year | Tax Paid | Tax Assessment Tax Assessment Total Assessment is a certain percentage of the fair market value that is determined by local assessors to be the total taxable value of land and additions on the property. | Land | Improvement |
|---|---|---|---|---|
| 2025 | $6,215 | $402,255 | $150,000 | $252,255 |
| 2024 | $6,215 | $365,889 | $150,000 | $285,203 |
| 2023 | $6,215 | $332,626 | $120,000 | $274,402 |
| 2022 | $6,930 | $302,387 | $90,000 | $269,402 |
| 2021 | $6,419 | $274,897 | $65,000 | $209,897 |
| 2020 | $6,323 | $258,081 | $65,000 | $193,081 |
| 2019 | $6,714 | $263,603 | $55,000 | $208,603 |
| 2018 | $6,220 | $243,233 | $55,000 | $188,446 |
| 2017 | $5,654 | $226,510 | $45,000 | $181,510 |
| 2016 | $5,175 | $201,019 | $45,000 | $156,019 |
| 2015 | $3,803 | $171,158 | $35,000 | $136,158 |
Source: Public Records
Map
Nearby Homes
- 970 W Cedar St
- 930 W Cedar St
- 860 Mellanie Ct
- 870 Mellanie Ct
- 910 W Cedar St
- 951 W Cedar St
- 971 W Cedar St
- 751 Tolleson Dr
- 880 Mellanie Ct
- 771 Tolleson Dr
- 804 W Cedar St
- 911 W Cedar St
- 811 Tolleson Dr
- 731 Tolleson Dr
- 950 W Bois d Arc St
- 930 Mellanie Ct
- 970 W Bois d Arc St
- 531 S Alabama St
- 950 Mellanie Ct
- 930 W Bois d Arc St