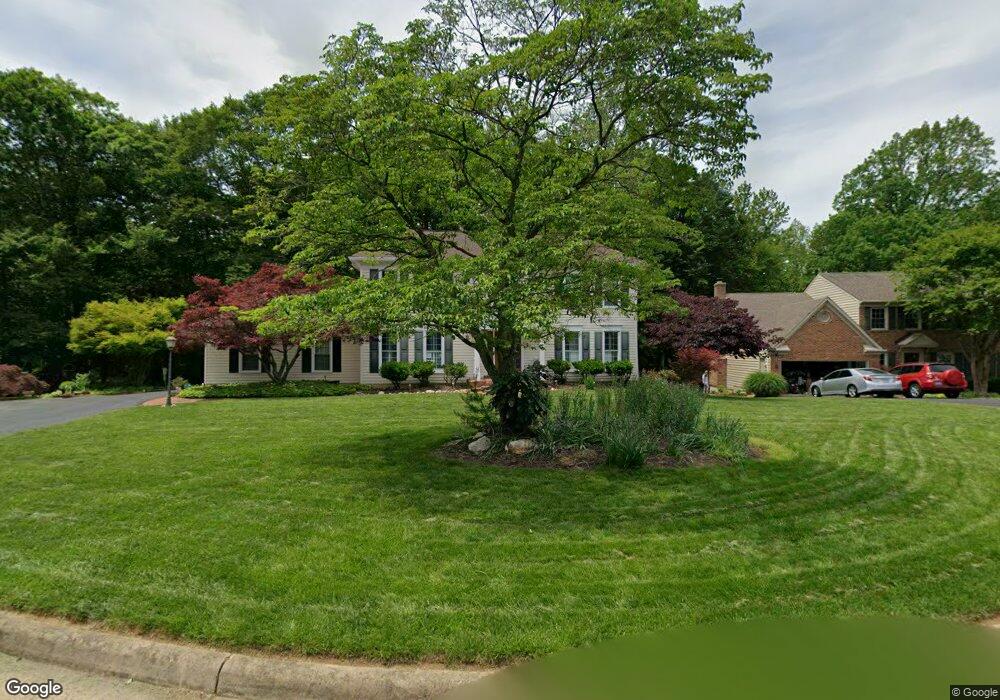
9508 Oak Stream Ct Fairfax Station, VA 22039
Estimated Value: $997,181 - $1,052,000
4
Beds
4
Baths
2,490
Sq Ft
$415/Sq Ft
Est. Value
About This Home
This home is located at 9508 Oak Stream Ct, Fairfax Station, VA 22039 and is currently estimated at $1,032,295, approximately $414 per square foot. 9508 Oak Stream Ct is a home located in Fairfax County with nearby schools including Silverbrook Elementary School, South County Middle School, and South County High School.
Ownership History
Date
Name
Owned For
Owner Type
Purchase Details
Closed on
Oct 16, 2023
Sold by
Dilbeck Eric M and Dilbeck Susan T
Bought by
Dilbeck Eric M and Dilbeck Susan T
Current Estimated Value
Purchase Details
Closed on
Feb 27, 1997
Sold by
Mcerlean Donald P and Mcerlean Sally S
Bought by
Dilbeck Eric M and Dilbeck Susan T
Home Financials for this Owner
Home Financials are based on the most recent Mortgage that was taken out on this home.
Original Mortgage
$228,000
Interest Rate
7.78%
Mortgage Type
New Conventional
Purchase Details
Closed on
Jul 5, 1994
Sold by
Sewell John E
Bought by
Mcerlean Donald P
Home Financials for this Owner
Home Financials are based on the most recent Mortgage that was taken out on this home.
Original Mortgage
$192,500
Interest Rate
8.55%
Create a Home Valuation Report for This Property
The Home Valuation Report is an in-depth analysis detailing your home's value as well as a comparison with similar homes in the area
Home Values in the Area
Average Home Value in this Area
Purchase History
| Date | Buyer | Sale Price | Title Company |
|---|---|---|---|
| Dilbeck Eric M | -- | None Listed On Document | |
| Dilbeck Eric M | $285,000 | -- | |
| Mcerlean Donald P | $292,500 | -- |
Source: Public Records
Mortgage History
| Date | Status | Borrower | Loan Amount |
|---|---|---|---|
| Previous Owner | Mcerlean Donald P | $228,000 | |
| Previous Owner | Mcerlean Donald P | $192,500 |
Source: Public Records
Tax History Compared to Growth
Tax History
| Year | Tax Paid | Tax Assessment Tax Assessment Total Assessment is a certain percentage of the fair market value that is determined by local assessors to be the total taxable value of land and additions on the property. | Land | Improvement |
|---|---|---|---|---|
| 2025 | $10,202 | $920,620 | $376,000 | $544,620 |
| 2024 | $10,202 | $880,660 | $356,000 | $524,660 |
| 2023 | $9,220 | $817,040 | $326,000 | $491,040 |
| 2022 | $8,476 | $741,240 | $276,000 | $465,240 |
| 2021 | $8,060 | $686,860 | $251,000 | $435,860 |
| 2020 | $7,759 | $655,570 | $231,000 | $424,570 |
| 2019 | $7,432 | $627,940 | $231,000 | $396,940 |
| 2018 | $7,221 | $627,940 | $231,000 | $396,940 |
| 2017 | $7,139 | $614,930 | $228,000 | $386,930 |
| 2016 | $7,124 | $614,930 | $228,000 | $386,930 |
| 2015 | $6,996 | $626,900 | $228,000 | $398,900 |
| 2014 | $6,732 | $604,560 | $221,000 | $383,560 |
Source: Public Records
Map
Nearby Homes
- 9524 Oak Stream Ct
- 8004 Chippenham Ct
- 9419 Braymore Cir
- 9616 Burnt Oak Dr
- 8003 Comerford Dr
- 9211 Bexleywood Ct
- 7834 Preakness Ln
- 7840 Preakness Ln
- 8300 Greentree Manor Ln
- 7706 Woodshade Ct
- 9226 Northedge Dr
- 9303 Macswain Place
- 7753 Northedge Ct
- 9849 S Park Cir
- 8106 Oak Hollow Ct
- 7411 Reservation Dr
- 9745 Rolling Ridge Dr
- 7832 Valleyfield Dr
- 9007 Golden Sunset Ln
- 8197 Cottage Rose Ct
- 9506 Oak Stream Ct
- 9509 Oak Stream Ct
- 9507 Oak Stream Ct
- 9504 Oak Stream Ct
- 9511 Oak Stream Ct
- 9505 Oak Stream Ct
- 9501 Oak Stream Ct
- 9413 Englefield Ct
- 9520 Oak Stream Ct
- 9502 Oak Stream Ct
- 9415 Englefield Ct
- 9417 Englefield Ct
- 9500 Oak Stream Ct
- 9503 Oak Stream Ct
- 9522 Oak Stream Ct
- 9411 Englefield Ct
- 9521 Oak Stream Ct
- 9414 Englefield Ct
- 9412 Englefield Ct
- 8055 Oak Crest Ln