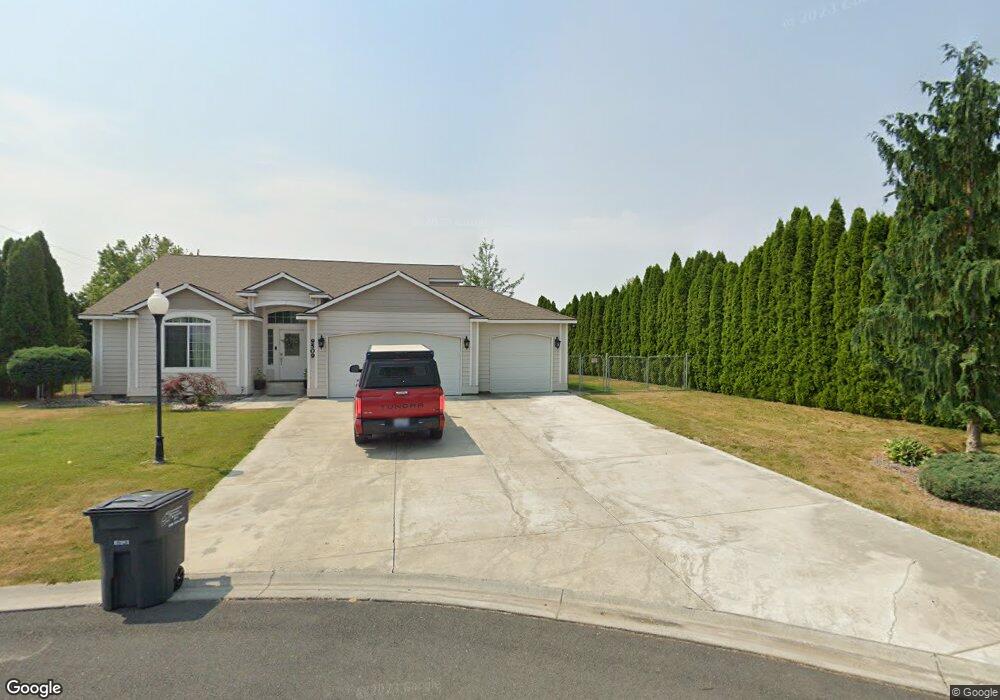
9509 Benjamin Way SE Moses Lake, WA 98837
Estimated Value: $437,000 - $484,000
3
Beds
2
Baths
1,512
Sq Ft
$298/Sq Ft
Est. Value
About This Home
This home is located at 9509 Benjamin Way SE, Moses Lake, WA 98837 and is currently estimated at $450,450, approximately $297 per square foot. 9509 Benjamin Way SE is a home located in Grant County with nearby schools including Sage Point Elementary School, Columbia Middle School, and Moses Lake High School.
Ownership History
Date
Name
Owned For
Owner Type
Purchase Details
Closed on
Jun 29, 2021
Sold by
Smith Melaniea
Bought by
Dorsey Hillary Nicole
Current Estimated Value
Home Financials for this Owner
Home Financials are based on the most recent Mortgage that was taken out on this home.
Original Mortgage
$392,850
Outstanding Balance
$356,450
Interest Rate
2.9%
Mortgage Type
New Conventional
Estimated Equity
$94,000
Purchase Details
Closed on
Mar 5, 2010
Sold by
Read Tammy Lynn
Bought by
Smith Melanie A
Home Financials for this Owner
Home Financials are based on the most recent Mortgage that was taken out on this home.
Original Mortgage
$202,040
Interest Rate
4.93%
Mortgage Type
New Conventional
Purchase Details
Closed on
Oct 16, 2006
Sold by
Read Tammy Lynn
Bought by
Read Tammy Lynn and The Tammy Lynn Read Revocable Living Tr
Purchase Details
Closed on
Jun 14, 2006
Sold by
Carlile Logan W and Carlile Michael Anne
Bought by
Read Tammy Lynn
Create a Home Valuation Report for This Property
The Home Valuation Report is an in-depth analysis detailing your home's value as well as a comparison with similar homes in the area
Home Values in the Area
Average Home Value in this Area
Purchase History
| Date | Buyer | Sale Price | Title Company |
|---|---|---|---|
| Dorsey Hillary Nicole | $405,000 | Frontier Title & Escrow Co | |
| Smith Melanie A | -- | Stewart-Security Title | |
| Read Tammy Lynn | -- | None Available | |
| Read Tammy Lynn | $232,680 | Security Title Guara |
Source: Public Records
Mortgage History
| Date | Status | Borrower | Loan Amount |
|---|---|---|---|
| Open | Dorsey Hillary Nicole | $392,850 | |
| Previous Owner | Smith Melanie A | $202,040 |
Source: Public Records
Tax History Compared to Growth
Tax History
| Year | Tax Paid | Tax Assessment Tax Assessment Total Assessment is a certain percentage of the fair market value that is determined by local assessors to be the total taxable value of land and additions on the property. | Land | Improvement |
|---|---|---|---|---|
| 2024 | $3,825 | $339,664 | $55,300 | $284,364 |
| 2023 | $3,156 | $271,215 | $42,700 | $228,515 |
| 2022 | $3,193 | $271,215 | $42,700 | $228,515 |
| 2021 | $2,797 | $271,215 | $42,700 | $228,515 |
| 2020 | $3,104 | $230,040 | $42,700 | $187,340 |
| 2019 | $3,026 | $213,120 | $42,700 | $170,420 |
| 2018 | $3,172 | $205,125 | $42,700 | $162,425 |
| 2017 | $2,960 | $191,440 | $40,000 | $151,440 |
| 2016 | $2,886 | $183,045 | $40,000 | $143,045 |
| 2013 | -- | $175,895 | $40,000 | $135,895 |
Source: Public Records
Map
Nearby Homes
- 9307 Albert Way SE
- 9343 Albert Way SE
- 9460 Albert Way SE
- 9561 Baseline 5 Rd SE
- 395 Baseline 5 Rd SE
- 9305 Naples St SE
- 9389 Baseline 1 NE
- 331 Viewmont Dr SE
- 6 Pelican Place SE
- TBD Stacy Dr SE
- 0 Stacy Dr SE Unit NWM2409070
- 446 Viewmont Dr SE
- 253 Karl Rd NE
- 527 Road I 6 NE
- 8084 Dune Lake Rd SE
- 8499 Dune Lake Rd SE
- 9747 Road 1 NE
- 8296 Dune Lake Rd SE
- 720 S Kennedy Place
- 3429 W Glenmoor Dr
- 9489 Benjamin Way SE
- 245 Scenic Dr SE
- 9469 Benjamin Way SE
- 9572 Vernal Ave SE
- 9488 Benjamin Way SE
- 263 Scenic Dr SE
- 9586 Vernal Ave SE
- 9451 Benjamin Way SE
- 9468 Benjamin Way SE
- 283 Scenic Dr SE
- 9562 Vernal Ave SE
- 9450 Benjamin Way SE
- 9197 Albert Way SE
- 9221 Albert Way SE
- 9243 Albert Way SE
- 9546 Vernal Ave SE
- 9255 Albert Way SE
- 246 Scenic Dr SE
- 9411 Benjamin Way SE
- 9194 Albert Way SE