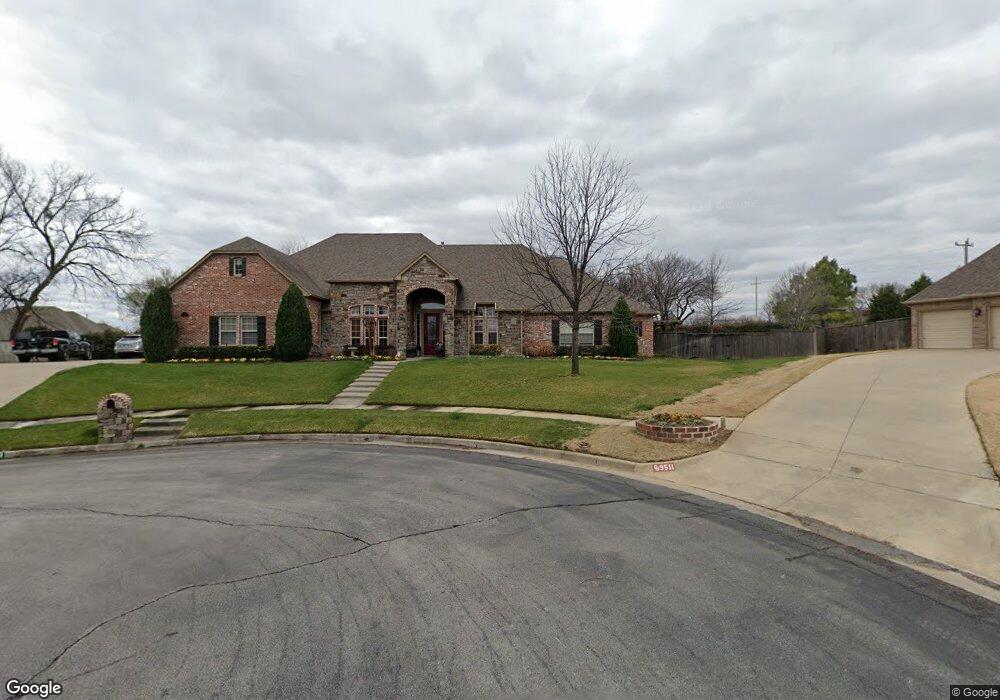
9509 N 139th East Ct Owasso, OK 74055
Estimated Value: $570,242 - $647,000
--
Bed
2
Baths
3,978
Sq Ft
$151/Sq Ft
Est. Value
About This Home
This home is located at 9509 N 139th East Ct, Owasso, OK 74055 and is currently estimated at $600,311, approximately $150 per square foot. 9509 N 139th East Ct is a home located in Tulsa County with nearby schools including Hayward Smith Elementary School, Owasso 6th Grade Center, and Owasso 8th Grade Center.
Ownership History
Date
Name
Owned For
Owner Type
Purchase Details
Closed on
Apr 17, 2020
Sold by
Loving Paul and Loving Wilma
Bought by
Loving Paul D and Rlt Wilma
Current Estimated Value
Purchase Details
Closed on
Nov 1, 2007
Sold by
Odell Curtis A and Odell Stacy A
Bought by
Loving Paul and Loving Wilma
Purchase Details
Closed on
Dec 1, 2005
Sold by
Tyann Development Inc
Bought by
Odell Curtis A and Odell Stacy A
Create a Home Valuation Report for This Property
The Home Valuation Report is an in-depth analysis detailing your home's value as well as a comparison with similar homes in the area
Home Values in the Area
Average Home Value in this Area
Purchase History
| Date | Buyer | Sale Price | Title Company |
|---|---|---|---|
| Loving Paul D | -- | None Available | |
| Loving Paul | $440,000 | Tulsa Abstract & Title Co | |
| Odell Curtis A | $52,000 | -- |
Source: Public Records
Tax History Compared to Growth
Tax History
| Year | Tax Paid | Tax Assessment Tax Assessment Total Assessment is a certain percentage of the fair market value that is determined by local assessors to be the total taxable value of land and additions on the property. | Land | Improvement |
|---|---|---|---|---|
| 2024 | $5,828 | $56,231 | $5,250 | $50,981 |
| 2023 | $5,828 | $53,553 | $5,000 | $48,553 |
| 2022 | $5,796 | $51,003 | $5,720 | $45,283 |
| 2021 | $5,594 | $49,720 | $5,720 | $44,000 |
| 2020 | $5,593 | $49,720 | $5,720 | $44,000 |
| 2019 | $5,569 | $49,720 | $5,720 | $44,000 |
| 2018 | $5,395 | $49,720 | $5,720 | $44,000 |
| 2017 | $5,413 | $49,720 | $5,720 | $44,000 |
| 2016 | $5,433 | $49,720 | $5,720 | $44,000 |
| 2015 | $5,473 | $49,720 | $5,720 | $44,000 |
| 2014 | $5,523 | $49,720 | $5,720 | $44,000 |
Source: Public Records
Map
Nearby Homes
- 0 96 St N Unit 2536799
- 13601 E 96th St N
- 9400 N 138th East Ave
- 9518 N 143rd Ct E
- 11412 E 93rd Place N
- 9311 N 139th East Ave
- 14316 E 94th St N
- 9218 N 141st East Ave
- 9225 N 133rd East Ave
- 13215 E 93rd St N
- 13207 E 93rd St N
- 13907 E 90th St N
- 14011 E 90th St N
- 9908 N 129th East Ave
- 8925 N 138th East Ave
- 10102 N 147th East Ave
- 12805 E 101st Place N
- 12927 E 101st St N
- 13804 E 88th St N
- 8813 N 144th East Ave
- 9511 N 139th East Ct
- 9510 N 137th East Ct
- 9507 N 139th East Ct
- 9510 N 139th East Ct
- 9508 N 139th Ct E
- 9508 N 139th East Ct
- 9508 N 137th East Ct
- 9512 N 137th East Ct
- 9501 N 139th Ct E
- 9506 N 139th East Ct
- 11599 E 96th St N
- 0 E 96 St N Unit 2002378
- 0 96 St N Unit 2002380
- 9500 N 137th East Ct
- 9511 N 137th East Ct
- 13918 E 96th St N
- 9509 N 137th East Ct
- 13909 E 96th St N
- 13717 E 96th St N
- 9507 N 137th East Ct