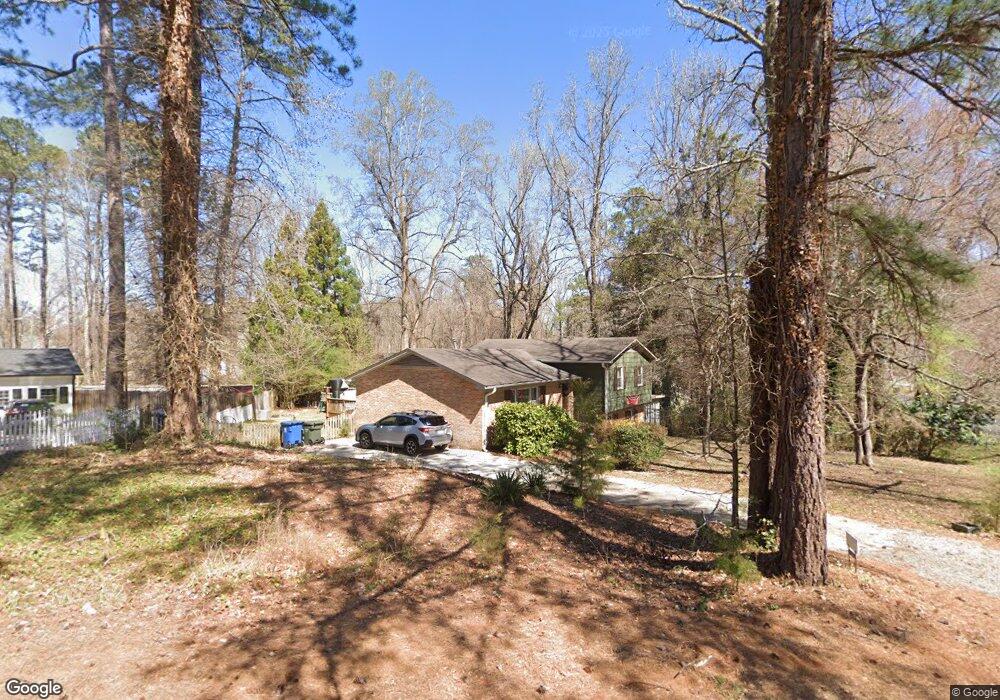
951 Clarion Dr Durham, NC 27705
Croasdaile NeighborhoodEstimated Value: $443,000 - $500,000
4
Beds
3
Baths
2,070
Sq Ft
$228/Sq Ft
Est. Value
About This Home
This home is located at 951 Clarion Dr, Durham, NC 27705 and is currently estimated at $472,762, approximately $228 per square foot. 951 Clarion Dr is a home located in Durham County with nearby schools including Hillandale Elementary School, George L Carrington Middle, and Riverside High School.
Ownership History
Date
Name
Owned For
Owner Type
Purchase Details
Closed on
Apr 18, 2016
Sold by
Haynes Ruby T
Bought by
Linderman Kenneth F and Feingold Meredith A
Current Estimated Value
Home Financials for this Owner
Home Financials are based on the most recent Mortgage that was taken out on this home.
Original Mortgage
$180,000
Outstanding Balance
$143,140
Interest Rate
3.71%
Estimated Equity
$329,622
Purchase Details
Closed on
Mar 30, 2007
Sold by
Snowden Walter C and Snowden Maneke D
Bought by
Haynes Ruby T
Home Financials for this Owner
Home Financials are based on the most recent Mortgage that was taken out on this home.
Original Mortgage
$158,400
Interest Rate
6.27%
Purchase Details
Closed on
Nov 30, 2006
Sold by
Harris Daisy C
Bought by
Snowden Walter C
Home Financials for this Owner
Home Financials are based on the most recent Mortgage that was taken out on this home.
Original Mortgage
$118,400
Interest Rate
7.59%
Purchase Details
Closed on
Dec 18, 1999
Sold by
Nolte Tiia R
Bought by
Harris George and Harris Daisy C
Create a Home Valuation Report for This Property
The Home Valuation Report is an in-depth analysis detailing your home's value as well as a comparison with similar homes in the area
Home Values in the Area
Average Home Value in this Area
Purchase History
| Date | Buyer | Sale Price | Title Company |
|---|---|---|---|
| Linderman Kenneth F | $200,000 | -- | |
| Haynes Ruby T | $198,000 | None Available | |
| Snowden Walter C | $148,000 | None Available | |
| Harris George | $145,000 | -- |
Source: Public Records
Mortgage History
| Date | Status | Borrower | Loan Amount |
|---|---|---|---|
| Open | Linderman Kenneth F | $180,000 | |
| Previous Owner | Haynes Ruby T | $158,400 | |
| Previous Owner | Haynes Ruby T | $29,700 | |
| Previous Owner | Snowden Walter C | $118,400 |
Source: Public Records
Tax History Compared to Growth
Tax History
| Year | Tax Paid | Tax Assessment Tax Assessment Total Assessment is a certain percentage of the fair market value that is determined by local assessors to be the total taxable value of land and additions on the property. | Land | Improvement |
|---|---|---|---|---|
| 2025 | $4,174 | $421,019 | $181,125 | $239,894 |
| 2024 | $3,456 | $247,728 | $48,300 | $199,428 |
| 2023 | $3,245 | $247,728 | $48,300 | $199,428 |
| 2022 | $3,171 | $247,728 | $48,300 | $199,428 |
| 2021 | $3,156 | $247,728 | $48,300 | $199,428 |
| 2020 | $3,081 | $247,728 | $48,300 | $199,428 |
| 2019 | $3,081 | $247,728 | $48,300 | $199,428 |
| 2018 | $2,629 | $193,794 | $40,250 | $153,544 |
| 2017 | $2,609 | $193,794 | $40,250 | $153,544 |
| 2016 | $2,521 | $193,794 | $40,250 | $153,544 |
| 2015 | $2,262 | $163,389 | $34,859 | $128,530 |
| 2014 | $2,262 | $163,389 | $34,859 | $128,530 |
Source: Public Records
Map
Nearby Homes
- 208 Jefferson Dr
- 4411 Sunny Ct
- 2708 Ferrand Dr
- 3708 Knollwood Dr
- 4420 Dula St
- 2900 Beech Grove Dr
- 2625 Cohnwood Dr
- 4521 Myers Park Dr
- 3012 Beech Grove Dr
- 149 Baldwin Dr
- 4408 Cheshire Ct
- 1214 E Oak Dr
- 2606 Newquay St
- 46 Sparger Springs Ln
- 32 Sparger Springs Ln
- 1009 Crescent Moon Ct
- 1417 Colewood Dr
- 4219 Berini Dr
- Alexander Plan at Stonewood Estates - Legacy
- Collins Plan at Stonewood Estates - Legacy
- 915 Chalice St
- 953 Clarion Dr
- 947 Clarion Dr
- 911 Chalice St
- 948 Clarion Dr
- 952 Clarion Dr
- 944 Clarion Dr
- 943 Clarion Dr
- 907 Chalice St
- 3503 Cole Mill Rd
- 3406 Cole Mill Rd
- 3408 Cole Mill Rd
- 3404 Cole Mill Rd
- 3309 Cole Mill Rd
- 101 Jefferson Dr
- 4436 Sunny Ct
- 3410 Cole Mill Rd
- 940 Clarion Dr
- 3301 W Wyndham Ln
- 901 Chalice St