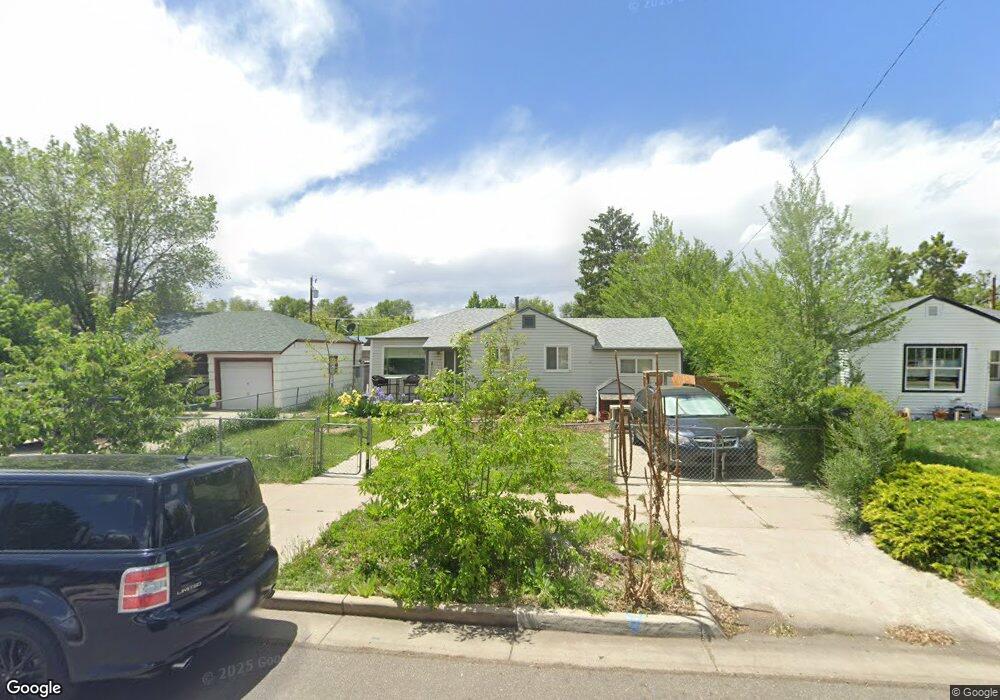
951 Hooker St Denver, CO 80204
Villa Park NeighborhoodEstimated Value: $414,588 - $437,000
3
Beds
1
Bath
891
Sq Ft
$480/Sq Ft
Est. Value
About This Home
This home is located at 951 Hooker St, Denver, CO 80204 and is currently estimated at $427,897, approximately $480 per square foot. 951 Hooker St is a home located in Denver County with nearby schools including Eagleton Elementary School, Lake Middle School, and North High School.
Ownership History
Date
Name
Owned For
Owner Type
Purchase Details
Closed on
Jun 2, 2017
Sold by
Chea Charles
Bought by
Bartley Christopher N and Bartley James P
Current Estimated Value
Home Financials for this Owner
Home Financials are based on the most recent Mortgage that was taken out on this home.
Original Mortgage
$304,385
Outstanding Balance
$248,781
Interest Rate
3.75%
Mortgage Type
FHA
Estimated Equity
$179,116
Purchase Details
Closed on
Sep 19, 2006
Sold by
Boehm Katherine L
Bought by
Chea Charles
Home Financials for this Owner
Home Financials are based on the most recent Mortgage that was taken out on this home.
Original Mortgage
$154,082
Interest Rate
6.51%
Mortgage Type
FHA
Purchase Details
Closed on
Apr 19, 2004
Sold by
Chea Michael and Chea Maria
Bought by
Boehm Kathy and Boehm Neal
Purchase Details
Closed on
May 12, 1999
Sold by
Chea Malaquias J
Bought by
Chea Michael D and Boehm Katherine L
Create a Home Valuation Report for This Property
The Home Valuation Report is an in-depth analysis detailing your home's value as well as a comparison with similar homes in the area
Home Values in the Area
Average Home Value in this Area
Purchase History
| Date | Buyer | Sale Price | Title Company |
|---|---|---|---|
| Bartley Christopher N | $310,000 | First American | |
| Chea Charles | $156,500 | Land Title Guarantee Company | |
| Boehm Kathy | -- | -- | |
| Chea Michael D | -- | -- |
Source: Public Records
Mortgage History
| Date | Status | Borrower | Loan Amount |
|---|---|---|---|
| Open | Bartley Christopher N | $304,385 | |
| Previous Owner | Chea Charles | $154,082 |
Source: Public Records
Tax History
| Year | Tax Paid | Tax Assessment Tax Assessment Total Assessment is a certain percentage of the fair market value that is determined by local assessors to be the total taxable value of land and additions on the property. | Land | Improvement |
|---|---|---|---|---|
| 2025 | $2,014 | $31,530 | $15,410 | $15,410 |
| 2024 | $2,014 | $25,430 | $15,150 | $10,280 |
| 2023 | $1,970 | $25,430 | $15,150 | $10,280 |
| 2022 | $1,871 | $23,530 | $9,760 | $13,770 |
| 2021 | $1,806 | $24,200 | $10,040 | $14,160 |
| 2020 | $1,696 | $22,860 | $8,490 | $14,370 |
| 2019 | $1,649 | $22,860 | $8,490 | $14,370 |
| 2018 | $1,145 | $14,800 | $6,750 | $8,050 |
| 2017 | $1,142 | $14,800 | $6,750 | $8,050 |
| 2016 | $918 | $11,260 | $3,733 | $7,527 |
| 2015 | $880 | $11,480 | $3,733 | $7,747 |
| 2014 | $659 | $7,940 | $1,990 | $5,950 |
Source: Public Records
Map
Nearby Homes
Your Personal Tour Guide
Ask me questions while you tour the home.