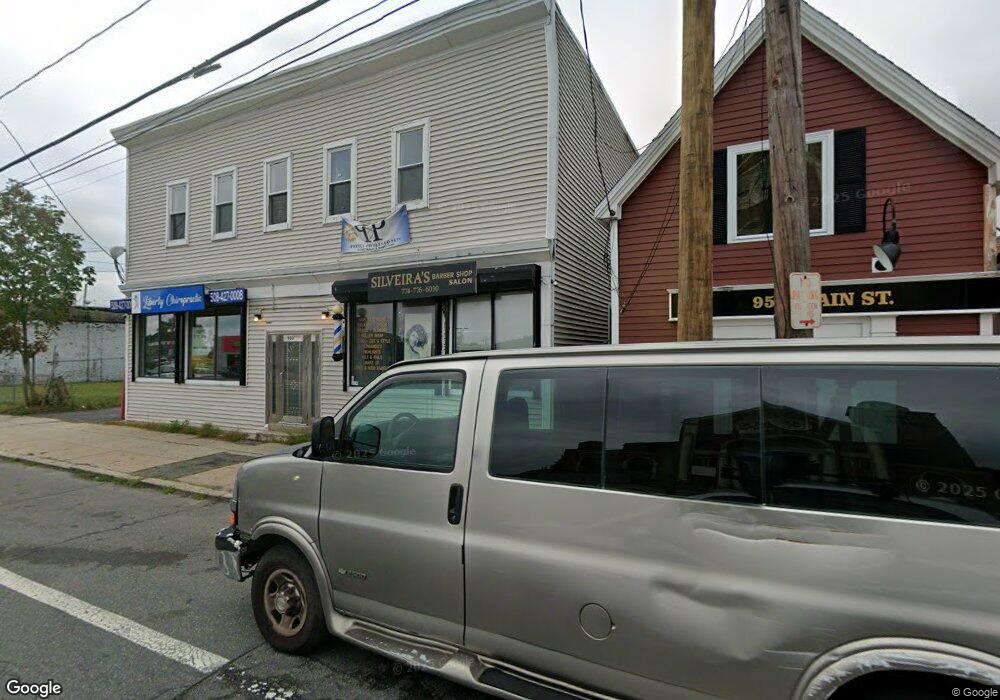
951 Main St Brockton, MA 02301
Clifton Heights NeighborhoodEstimated Value: $113,375
1
Bed
--
Bath
833
Sq Ft
$136/Sq Ft
Est. Value
About This Home
This home is located at 951 Main St, Brockton, MA 02301 and is currently estimated at $113,375, approximately $136 per square foot. 951 Main St is a home located in Plymouth County with nearby schools including Davis K-8 School, John F. Kennedy Elementary School, and South Middle School.
Ownership History
Date
Name
Owned For
Owner Type
Purchase Details
Closed on
Mar 28, 2012
Sold by
Re Real Estate Corp
Bought by
Wgsc Rt
Current Estimated Value
Purchase Details
Closed on
Dec 27, 2002
Sold by
951 N Main St Rt
Bought by
Jfc Rt
Home Financials for this Owner
Home Financials are based on the most recent Mortgage that was taken out on this home.
Original Mortgage
$250,000
Interest Rate
6.02%
Mortgage Type
Commercial
Purchase Details
Closed on
Jan 11, 1993
Sold by
Zipeto John L and Zipeto Alda M
Bought by
R E Re Corp
Create a Home Valuation Report for This Property
The Home Valuation Report is an in-depth analysis detailing your home's value as well as a comparison with similar homes in the area
Home Values in the Area
Average Home Value in this Area
Purchase History
| Date | Buyer | Sale Price | Title Company |
|---|---|---|---|
| Wgsc Rt | $45,000 | -- | |
| Jfc Rt | $295,000 | -- | |
| R E Re Corp | $35,000 | -- |
Source: Public Records
Mortgage History
| Date | Status | Borrower | Loan Amount |
|---|---|---|---|
| Previous Owner | R E Re Corp | $250,000 |
Source: Public Records
Tax History Compared to Growth
Tax History
| Year | Tax Paid | Tax Assessment Tax Assessment Total Assessment is a certain percentage of the fair market value that is determined by local assessors to be the total taxable value of land and additions on the property. | Land | Improvement |
|---|---|---|---|---|
| 2025 | $3,664 | $151,400 | $105,200 | $46,200 |
| 2024 | $3,357 | $139,600 | $95,600 | $44,000 |
| 2023 | $2,776 | $106,700 | $66,700 | $40,000 |
| 2022 | $2,903 | $103,000 | $66,700 | $36,300 |
| 2021 | $2,908 | $98,100 | $63,500 | $34,600 |
| 2020 | $2,463 | $81,000 | $60,500 | $20,500 |
| 2019 | $2,508 | $79,200 | $60,500 | $18,700 |
| 2018 | $2,609 | $79,200 | $60,500 | $18,700 |
| 2017 | $2,609 | $79,200 | $60,500 | $18,700 |
| 2016 | $2,147 | $67,050 | $60,470 | $6,580 |
| 2015 | $2,272 | $67,050 | $60,470 | $6,580 |
| 2014 | $2,277 | $67,050 | $60,470 | $6,580 |
Source: Public Records
Map
Nearby Homes
- 953 Main St Unit L1
- 953 Main St Unit 4
- 953 Main St Unit R2
- 953 Main St Unit L2
- 953 Main St Unit 1,2,1,2
- 953 Main St Unit 1
- 953 Main St
- 953 Main St
- 84 Denton St
- 84 Denton St Unit 3
- 72 Denton St
- 957 Main St Unit 1
- 957 Main St Unit 2
- 963 Main St
- 88 Denton St
- 68 Denton St
- 66 Denton St
- 915 Main St
- 71 Denton St
- 79 Denton St