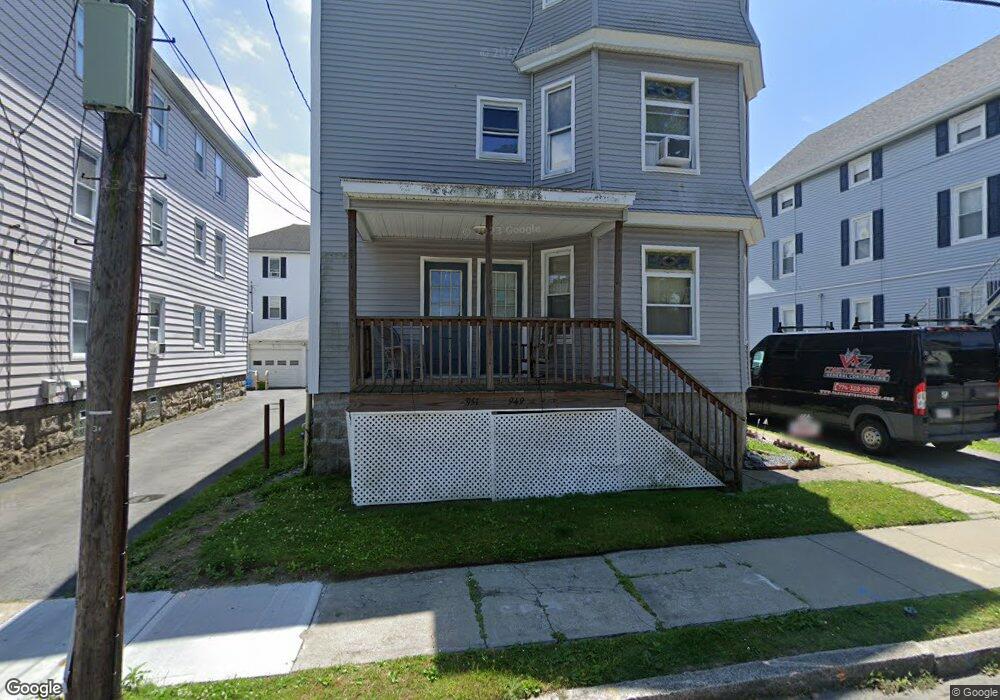
951 Maple St Fall River, MA 02720
Bank Street NeighborhoodEstimated Value: $615,000 - $760,000
9
Beds
3
Baths
4,239
Sq Ft
$162/Sq Ft
Est. Value
About This Home
This home is located at 951 Maple St, Fall River, MA 02720 and is currently estimated at $687,756, approximately $162 per square foot. 951 Maple St is a home located in Bristol County with nearby schools including Mary Fonseca Elementary School, Morton Middle School, and B M C Durfee High School.
Ownership History
Date
Name
Owned For
Owner Type
Purchase Details
Closed on
Aug 28, 2006
Sold by
Davis Edward J
Bought by
Davis Edward J and Davis Judith
Current Estimated Value
Purchase Details
Closed on
Jul 19, 1991
Sold by
Handell Morin A and Handell Estelle R
Bought by
Davis Edward J and Davis Ann M
Home Financials for this Owner
Home Financials are based on the most recent Mortgage that was taken out on this home.
Original Mortgage
$140,000
Interest Rate
9.36%
Mortgage Type
Purchase Money Mortgage
Create a Home Valuation Report for This Property
The Home Valuation Report is an in-depth analysis detailing your home's value as well as a comparison with similar homes in the area
Home Values in the Area
Average Home Value in this Area
Purchase History
| Date | Buyer | Sale Price | Title Company |
|---|---|---|---|
| Davis Edward J | -- | -- | |
| Davis Edward J | $150,000 | -- |
Source: Public Records
Mortgage History
| Date | Status | Borrower | Loan Amount |
|---|---|---|---|
| Open | Davis Edward J | $105,640 | |
| Previous Owner | Davis Edward J | $140,000 |
Source: Public Records
Tax History
| Year | Tax Paid | Tax Assessment Tax Assessment Total Assessment is a certain percentage of the fair market value that is determined by local assessors to be the total taxable value of land and additions on the property. | Land | Improvement |
|---|---|---|---|---|
| 2025 | $6,768 | $591,100 | $115,300 | $475,800 |
| 2024 | $4,779 | $415,900 | $113,100 | $302,800 |
| 2023 | $6,280 | $511,800 | $101,900 | $409,900 |
| 2022 | $5,539 | $438,900 | $96,100 | $342,800 |
| 2021 | $5,024 | $363,300 | $91,800 | $271,500 |
| 2020 | $4,452 | $308,100 | $87,600 | $220,500 |
| 2019 | $3,875 | $265,800 | $91,600 | $174,200 |
| 2018 | $3,535 | $241,800 | $92,300 | $149,500 |
| 2017 | $3,385 | $241,800 | $92,300 | $149,500 |
| 2016 | $3,281 | $240,700 | $95,100 | $145,600 |
| 2015 | $3,148 | $240,700 | $95,100 | $145,600 |
| 2014 | $3,208 | $255,000 | $95,100 | $159,900 |
Source: Public Records
Map
Nearby Homes
- 45-47 Shawmut St
- 545 Robeson St
- 884 Cherry St
- 273 Tremont St
- 243 Robeson St Unit 6
- 243 Robeson St Unit 3
- 218 Plain St
- 992 Pine St
- 217 Plain St
- 65 Bigelow St
- 631 Walnut St
- 610 Walnut St
- 499 Hanover St
- 108 Garden St
- 528 Cherry St Unit 3
- 499 Maple St
- 503 Highland Ave
- 501 Pine St
- 511 Bank St
- 72 Belmont St
- 951 Maple St
- 951 Maple St Unit Maple 3rd Floor
- 949 Maple St Unit 1st Floor
- 957 Maple St
- 939 Maple St
- 106 Beverly St
- 927 Maple St
- 107 Home St
- 956 Maple St
- 123 Beverly St
- 100 Beverly St
- 98 Beverly St
- 972 Maple St
- 928 Maple St
- 107 Beverly St
- 82 Beverly St
- 23 Stetson St
- 97 Beverly St
- 926 Walnut St
- 32 Stetson St
Your Personal Tour Guide
Ask me questions while you tour the home.