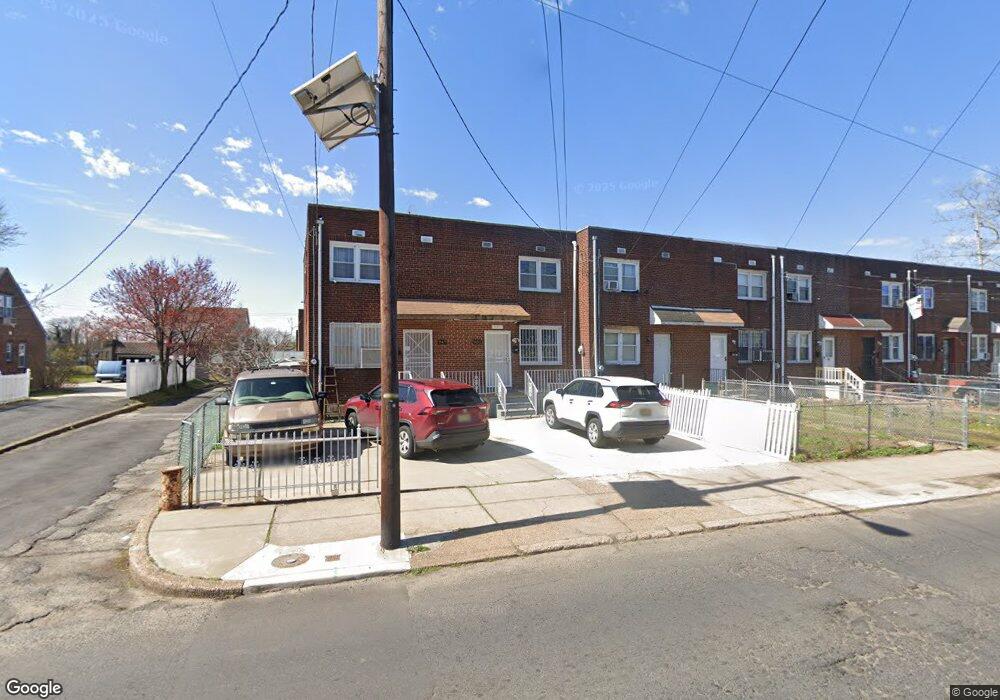
951 N 36th St Camden, NJ 08105
Cramer Hill NeighborhoodEstimated Value: $141,000 - $199,000
3
Beds
1
Bath
1,120
Sq Ft
$154/Sq Ft
Est. Value
About This Home
This home is located at 951 N 36th St, Camden, NJ 08105 and is currently estimated at $172,428, approximately $153 per square foot. 951 N 36th St is a home located in Camden County with nearby schools including Eastside High School, Camdens Promise Charter School, and Camden Forward School.
Ownership History
Date
Name
Owned For
Owner Type
Purchase Details
Closed on
Sep 29, 2016
Sold by
Martinez Jennifer
Bought by
Khalil Basem J and Khalil Najia B
Current Estimated Value
Purchase Details
Closed on
Mar 7, 2016
Sold by
Rivera Jose L
Bought by
Martinez Jennifer
Purchase Details
Closed on
Aug 3, 2015
Sold by
Martinez Jennifer
Bought by
Rivera Jose L
Purchase Details
Closed on
Jul 11, 2003
Sold by
Martinez Jessica
Bought by
Ryan Ana
Purchase Details
Closed on
Jul 23, 2001
Sold by
Ocwen Federal Bank
Bought by
Martinez Jessica
Create a Home Valuation Report for This Property
The Home Valuation Report is an in-depth analysis detailing your home's value as well as a comparison with similar homes in the area
Home Values in the Area
Average Home Value in this Area
Purchase History
| Date | Buyer | Sale Price | Title Company |
|---|---|---|---|
| Khalil Basem J | $50,000 | Surety Title Co | |
| Martinez Jennifer | -- | None Available | |
| Rivera Jose L | -- | Attorney | |
| Ryan Ana | -- | -- | |
| Martinez Jessica | $21,000 | -- | |
| Martinez Jessica | $21,000 | -- |
Source: Public Records
Tax History Compared to Growth
Tax History
| Year | Tax Paid | Tax Assessment Tax Assessment Total Assessment is a certain percentage of the fair market value that is determined by local assessors to be the total taxable value of land and additions on the property. | Land | Improvement |
|---|---|---|---|---|
| 2025 | $2,671 | $75,400 | $20,900 | $54,500 |
| 2024 | $2,582 | $75,400 | $20,900 | $54,500 |
| 2023 | $2,582 | $75,400 | $20,900 | $54,500 |
| 2022 | $2,534 | $75,400 | $20,900 | $54,500 |
| 2021 | $2,525 | $75,400 | $20,900 | $54,500 |
| 2020 | $2,398 | $75,400 | $20,900 | $54,500 |
| 2019 | $2,296 | $75,400 | $20,900 | $54,500 |
| 2018 | $2,284 | $75,400 | $20,900 | $54,500 |
| 2017 | $2,228 | $75,400 | $20,900 | $54,500 |
| 2016 | $2,157 | $75,400 | $20,900 | $54,500 |
| 2015 | $2,077 | $75,400 | $20,900 | $54,500 |
| 2014 | $2,027 | $75,400 | $20,900 | $54,500 |
Source: Public Records
Map
Nearby Homes
- 3265 River Ave
- 948 Bergen Ave
- 930 N 32nd St
- 900 Beideman Ave
- 3068 River Rd
- 1027 Lois Ave
- 1722 44th St
- 2816 Pleasant St
- 2849 Arthur Ave
- 420 N 36th St
- 1715 47th St
- 2830 Cleveland Ave
- 1824 44th St
- 2818 Cleveland Ave
- 2805 Polk Ave
- 2738 Lincoln Ave
- 3609 Westfield Ave
- 1828 47th St
- 2714 Arthur Ave
- 818 N 27th St