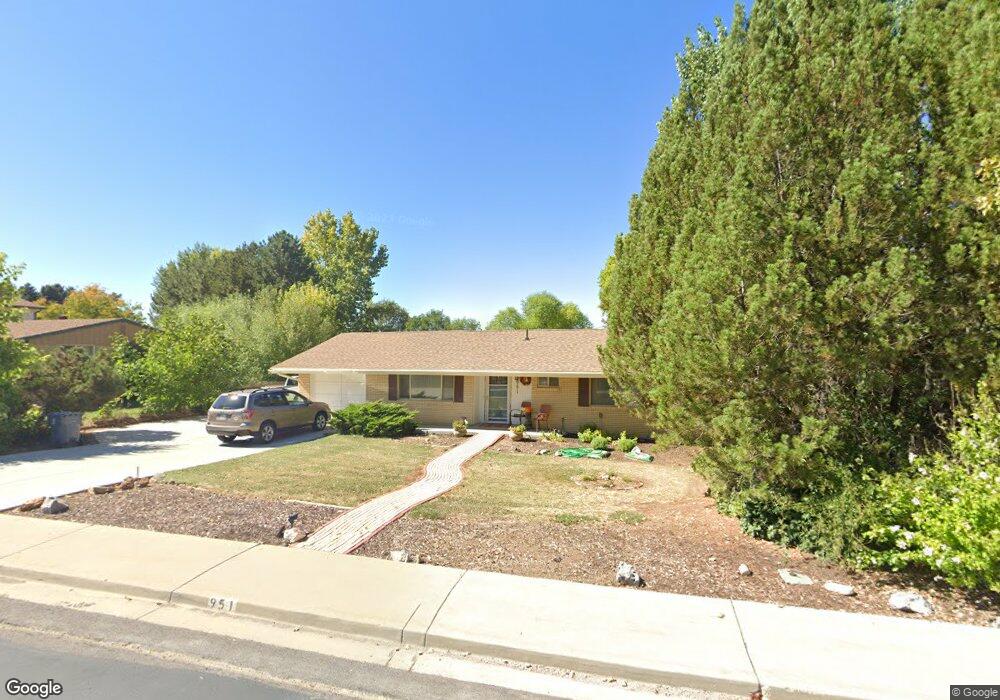
951 N 700 E Mapleton, UT 84664
Estimated Value: $514,050 - $612,000
3
Beds
2
Baths
1,450
Sq Ft
$387/Sq Ft
Est. Value
About This Home
This home is located at 951 N 700 E, Mapleton, UT 84664 and is currently estimated at $560,513, approximately $386 per square foot. 951 N 700 E is a home located in Utah County with nearby schools including Hobble Creek School, Mapleton Junior High School, and Maple Mountain High School.
Ownership History
Date
Name
Owned For
Owner Type
Purchase Details
Closed on
Jun 9, 2025
Sold by
Lape Sharon M and Lape Robert E
Bought by
Lape Sharon M and Lape Robert E
Current Estimated Value
Home Financials for this Owner
Home Financials are based on the most recent Mortgage that was taken out on this home.
Original Mortgage
$750,000
Outstanding Balance
$715,810
Interest Rate
6.76%
Mortgage Type
Reverse Mortgage Home Equity Conversion Mortgage
Estimated Equity
-$155,297
Purchase Details
Closed on
Nov 8, 2002
Sold by
Rose Patricia D
Bought by
Lape Sharon M and Lape Robert E
Purchase Details
Closed on
Mar 26, 1999
Sold by
Smithee Wm Trent
Bought by
Kuchenmeister Marie W
Purchase Details
Closed on
Nov 17, 1998
Sold by
Densley Stephanie T
Bought by
Smithee Wm Trent
Purchase Details
Closed on
Oct 13, 1998
Sold by
Smithee Raelene
Bought by
Smithee Wm Trent
Create a Home Valuation Report for This Property
The Home Valuation Report is an in-depth analysis detailing your home's value as well as a comparison with similar homes in the area
Home Values in the Area
Average Home Value in this Area
Purchase History
| Date | Buyer | Sale Price | Title Company |
|---|---|---|---|
| Lape Sharon M | -- | Sutherland Title | |
| Lape Sharon M | -- | -- | |
| Kuchenmeister Marie W | -- | Backman Stewart Title | |
| Smithee Wm Trent | -- | Wasatch Land & Title | |
| Smithee Wm Trent | -- | -- |
Source: Public Records
Mortgage History
| Date | Status | Borrower | Loan Amount |
|---|---|---|---|
| Open | Lape Sharon M | $750,000 | |
| Closed | Lape Sharon M | $750,000 |
Source: Public Records
Tax History
| Year | Tax Paid | Tax Assessment Tax Assessment Total Assessment is a certain percentage of the fair market value that is determined by local assessors to be the total taxable value of land and additions on the property. | Land | Improvement |
|---|---|---|---|---|
| 2025 | $2,287 | $241,065 | -- | -- |
| 2024 | $2,287 | $224,070 | $0 | $0 |
| 2023 | $2,330 | $229,680 | $0 | $0 |
| 2022 | $2,392 | $233,145 | $0 | $0 |
| 2021 | $1,916 | $286,800 | $170,100 | $116,700 |
| 2020 | $1,846 | $267,200 | $150,500 | $116,700 |
| 2019 | $1,664 | $245,900 | $144,400 | $101,500 |
| 2018 | $1,551 | $218,100 | $121,600 | $96,500 |
| 2017 | $1,501 | $112,035 | $0 | $0 |
| 2016 | $1,367 | $101,420 | $0 | $0 |
| 2015 | $1,258 | $92,785 | $0 | $0 |
| 2014 | $1,252 | $90,695 | $0 | $0 |
Source: Public Records
Map
Nearby Homes
- 594 E 1000 N
- 775 N 800 E
- 435 E 1000 N
- 1096 N 1000 E
- 265 E 600 N
- 1567 N 600 E Unit 26
- 310 N 800 E
- 897 N Main St
- 84 E 530 N
- 1350 N Main St
- 1447 N 1350 St E Unit 5
- 1577 N 1350 St E Unit 1
- 1477 N 1350 St E Unit 4
- 1547 N 1350 St E Unit 2
- 1511 N 1350 St E Unit 3
- 1548 N 1350 St E Unit 11
- 1578 N 1350 St E Unit 12
- 141 N 600 E
- 162 N 800 E
- 745 E Maple St
Your Personal Tour Guide
Ask me questions while you tour the home.