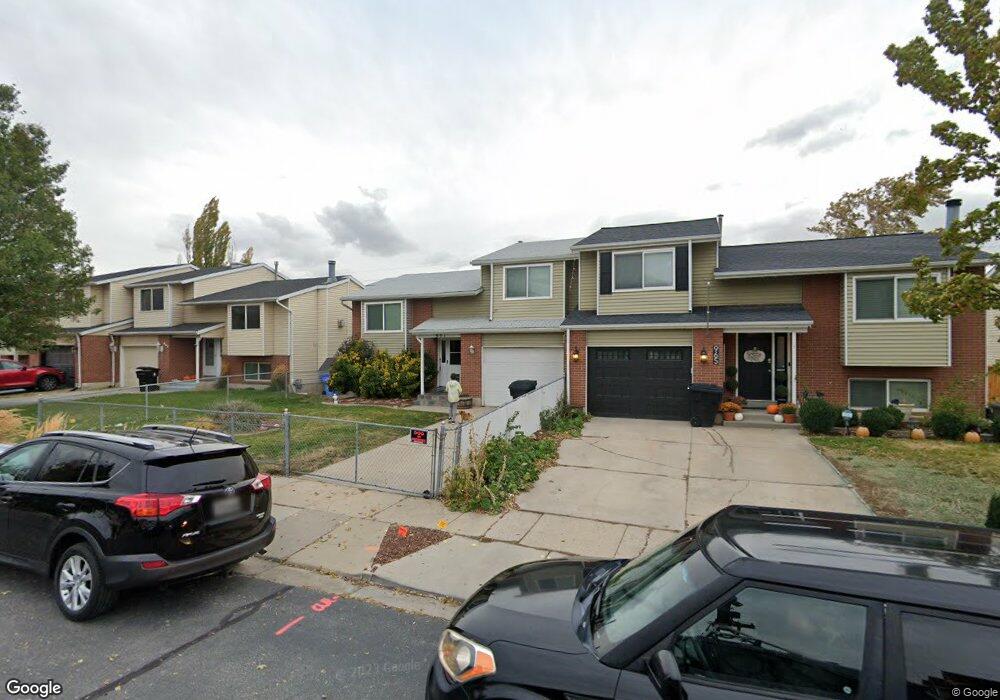
951 N 900 W West Bountiful, UT 84087
Estimated Value: $363,000 - $435,000
2
Beds
1
Bath
998
Sq Ft
$394/Sq Ft
Est. Value
About This Home
This home is located at 951 N 900 W, West Bountiful, UT 84087 and is currently estimated at $392,938, approximately $393 per square foot. 951 N 900 W is a home located in Davis County with nearby schools including West Bountiful Elementary School, Bountiful Junior High School, and Viewmont High School.
Ownership History
Date
Name
Owned For
Owner Type
Purchase Details
Closed on
Mar 21, 2023
Sold by
Johnson-Hill Bonnie Jean
Bought by
Johnson-Hill Bonnie Jean
Current Estimated Value
Home Financials for this Owner
Home Financials are based on the most recent Mortgage that was taken out on this home.
Original Mortgage
$30,000
Outstanding Balance
$29,056
Interest Rate
6.12%
Mortgage Type
Credit Line Revolving
Estimated Equity
$363,882
Purchase Details
Closed on
Mar 1, 1997
Sold by
Johnson Richard Peter and Johnson Bonnie Jean
Bought by
Johnson Bonnie Jean
Home Financials for this Owner
Home Financials are based on the most recent Mortgage that was taken out on this home.
Original Mortgage
$16,000
Interest Rate
7.81%
Create a Home Valuation Report for This Property
The Home Valuation Report is an in-depth analysis detailing your home's value as well as a comparison with similar homes in the area
Home Values in the Area
Average Home Value in this Area
Purchase History
| Date | Buyer | Sale Price | Title Company |
|---|---|---|---|
| Johnson-Hill Bonnie Jean | -- | First American Title | |
| Johnson Bonnie Jean | -- | Associated Title Company |
Source: Public Records
Mortgage History
| Date | Status | Borrower | Loan Amount |
|---|---|---|---|
| Open | Johnson-Hill Bonnie Jean | $30,000 | |
| Previous Owner | Johnson Bonnie Jean | $16,000 |
Source: Public Records
Tax History Compared to Growth
Tax History
| Year | Tax Paid | Tax Assessment Tax Assessment Total Assessment is a certain percentage of the fair market value that is determined by local assessors to be the total taxable value of land and additions on the property. | Land | Improvement |
|---|---|---|---|---|
| 2025 | $2,240 | $195,250 | $108,925 | $86,325 |
| 2024 | $2,109 | $188,100 | $88,806 | $99,294 |
| 2023 | $2,075 | $340,000 | $173,525 | $166,475 |
| 2022 | $2,041 | $187,000 | $0 | $187,000 |
| 2021 | $1,855 | $261,000 | $36,000 | $225,000 |
| 2020 | $1,639 | $228,000 | $35,400 | $192,600 |
| 2019 | $1,561 | $215,000 | $34,000 | $181,000 |
| 2018 | $1,442 | $196,000 | $34,000 | $162,000 |
| 2016 | $1,183 | $87,175 | $18,700 | $68,475 |
| 2015 | $1,121 | $78,320 | $18,700 | $59,620 |
| 2014 | $1,183 | $85,130 | $18,980 | $66,150 |
| 2013 | -- | $69,122 | $14,296 | $54,826 |
Source: Public Records
Map
Nearby Homes
- 825 W 1320 N
- 767 W 220 N
- 280 N 1100 W
- 1084 W Audrey Ln Unit 20
- 1084 W Audrey Ln
- 637 W 1600 N
- 790 N 500 W
- 366 W 1000 N
- 340 N 500 W Unit 204
- 789 W 1950 N
- 988 W 1950 N Unit 134
- 399 W 400 N Unit 47
- Lincoln Farmhouse Plan at Belmont Farms
- Belmont Traditional Plan at Belmont Farms
- Hampton Traditional Plan at Belmont Farms
- 2035 N 800 W
- 680 W 500 S Unit 22
- 680 W 500 S Unit 17
- Carson Plan at Amberly Place
- 2050 Farmhouse Plan at Amberly Place
- 937 N 900 W
- 965 N 900 W
- 923 N 900 W
- 981 N 900 W
- 907 N 900 W
- 993 N 900 W
- 893 N 900 W
- 932 N 900 W
- 894 Raintree Cir
- 895 Raintree Cir
- 999 N 900 W
- 900 W 1000 N
- 889 Raintree Cir
- 882 Raintree Cir
- 877 N 900 W Unit 1
- 877 N 900 W
- 896 Summer Tree Dr
- 888 Summer Tree Dr
- 885 Raintree Cir
- 888 W Heritage Point Ln Unit 9