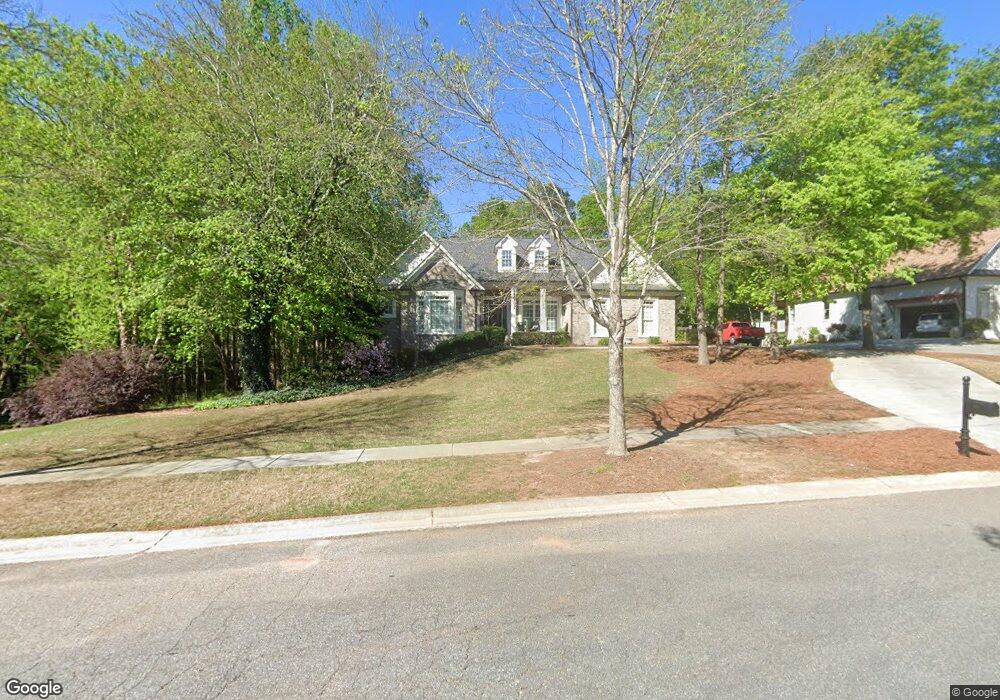
951 Providence Ln Monroe, GA 30656
Estimated Value: $517,000 - $655,000
4
Beds
4
Baths
4,337
Sq Ft
$137/Sq Ft
Est. Value
About This Home
This home is located at 951 Providence Ln, Monroe, GA 30656 and is currently estimated at $593,451, approximately $136 per square foot. 951 Providence Ln is a home located in Walton County with nearby schools including Walker Park Elementary School, Carver Middle School, and Monroe Area High School.
Ownership History
Date
Name
Owned For
Owner Type
Purchase Details
Closed on
Jul 15, 2016
Sold by
Julie M
Bought by
Haney Mark P
Current Estimated Value
Home Financials for this Owner
Home Financials are based on the most recent Mortgage that was taken out on this home.
Original Mortgage
$175,000
Outstanding Balance
$79,235
Interest Rate
3.54%
Mortgage Type
New Conventional
Estimated Equity
$514,216
Purchase Details
Closed on
Dec 3, 2007
Sold by
Haney Charles H
Bought by
Haney Julie M and Haney Mark P
Purchase Details
Closed on
Apr 1, 2004
Sold by
Rodriguez Hector J and Rodriguez Ximena
Bought by
Prudential Relocation
Purchase Details
Closed on
May 23, 2002
Sold by
J & D Homes
Bought by
Rodriguez Hector J and Rodriguez Ximena
Home Financials for this Owner
Home Financials are based on the most recent Mortgage that was taken out on this home.
Original Mortgage
$299,895
Interest Rate
5.63%
Mortgage Type
New Conventional
Create a Home Valuation Report for This Property
The Home Valuation Report is an in-depth analysis detailing your home's value as well as a comparison with similar homes in the area
Home Values in the Area
Average Home Value in this Area
Purchase History
| Date | Buyer | Sale Price | Title Company |
|---|---|---|---|
| Haney Mark P | -- | -- | |
| Haney Julie M | -- | -- | |
| Prudential Relocation | $324,000 | -- | |
| Rodriguez Hector J | $333,300 | -- |
Source: Public Records
Mortgage History
| Date | Status | Borrower | Loan Amount |
|---|---|---|---|
| Open | Haney Mark P | $175,000 | |
| Previous Owner | Rodriguez Hector J | $299,895 |
Source: Public Records
Tax History Compared to Growth
Tax History
| Year | Tax Paid | Tax Assessment Tax Assessment Total Assessment is a certain percentage of the fair market value that is determined by local assessors to be the total taxable value of land and additions on the property. | Land | Improvement |
|---|---|---|---|---|
| 2024 | $4,804 | $197,920 | $26,000 | $171,920 |
| 2023 | $4,386 | $191,280 | $26,000 | $165,280 |
| 2022 | $4,704 | $168,480 | $20,000 | $148,480 |
| 2021 | $4,340 | $143,320 | $20,000 | $123,320 |
| 2020 | $4,367 | $139,400 | $20,000 | $119,400 |
| 2019 | $4,210 | $131,440 | $30,000 | $101,440 |
| 2018 | $4,187 | $131,440 | $30,000 | $101,440 |
| 2017 | $4,330 | $125,680 | $30,000 | $95,680 |
| 2016 | $4,088 | $123,600 | $30,000 | $93,600 |
| 2015 | $3,898 | $114,000 | $30,000 | $84,000 |
| 2014 | $3,643 | $104,040 | $28,000 | $76,040 |
Source: Public Records
Map
Nearby Homes
- 960 Providence Ln
- 380 Fairway Cir
- 410 Providence Club Dr
- 3051 Glenview Ln
- 1035 Lucienne Blvd
- 1047 Lucienne Blvd
- 7357 Raleigh Way
- 4720 Bold Springs Rd NW
- 8165 Highway 81
- 8215 Highway 81
- 840 N Cross Lane Rd
- 3680 Apalachee Ridge
- 8275 Highway 81
- 8125 Highway 81
- 384 Winslow Ct
- 103 Camp Ct
- 480 Raider Way
- 0 Tanners Bridge Cir Unit 10536031
- 420 Stock Gap Rd SW
- 1074 Pine View Trail
- 997 Providence Ln
- 993 Providence Ln
- 981 Providence Ln
- 941 Providence Ln Unit 14E
- 941 Providence Ln
- 977 Providence Ln
- 969 Providence Ln
- 965 Providence Ln
- 998 Providence Ln
- 994 Providence Ln
- 978 Providence Ln
- 957 Providence Ln
- 974 Providence Ln
- 931 Providence Ln
- 966 Providence Ln
- 962 Providence Ln
- 950 Providence Ln
- 958 Providence Ln
- 954 Providence Ln
- 961 Providence Ln