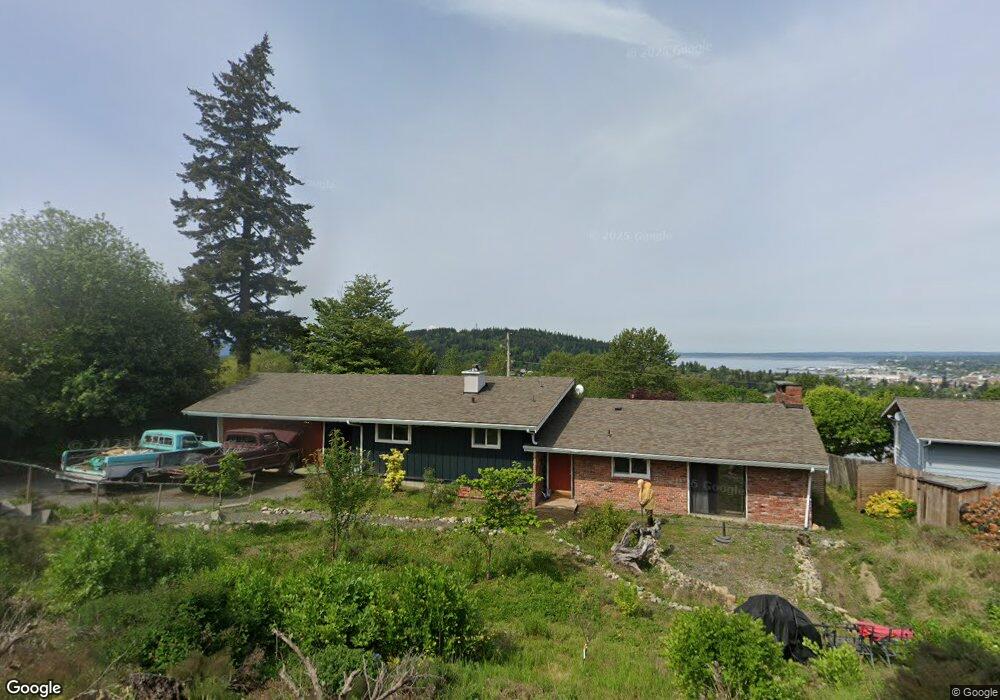
951 Queen St Bellingham, WA 98229
Puget NeighborhoodEstimated Value: $670,000 - $873,025
3
Beds
3
Baths
2,705
Sq Ft
$294/Sq Ft
Est. Value
About This Home
This home is located at 951 Queen St, Bellingham, WA 98229 and is currently estimated at $794,256, approximately $293 per square foot. 951 Queen St is a home located in Whatcom County with nearby schools including Carl Cozier Elementary School, Kulshan Middle School, and Sehome High School.
Ownership History
Date
Name
Owned For
Owner Type
Purchase Details
Closed on
May 26, 2010
Sold by
Findlay Britt J
Bought by
Halle Francis J and Halle Shelley
Current Estimated Value
Home Financials for this Owner
Home Financials are based on the most recent Mortgage that was taken out on this home.
Original Mortgage
$248,000
Outstanding Balance
$165,422
Interest Rate
5.03%
Mortgage Type
New Conventional
Estimated Equity
$628,834
Purchase Details
Closed on
Nov 7, 2001
Sold by
Findlay Britt J and Mackenzie Britt J
Bought by
Findlay Britt J
Purchase Details
Closed on
Feb 29, 2000
Sold by
Johnston Irvin A and Johnston Hildur E
Bought by
Mackenzie Britt J
Home Financials for this Owner
Home Financials are based on the most recent Mortgage that was taken out on this home.
Original Mortgage
$177,550
Interest Rate
8.26%
Create a Home Valuation Report for This Property
The Home Valuation Report is an in-depth analysis detailing your home's value as well as a comparison with similar homes in the area
Home Values in the Area
Average Home Value in this Area
Purchase History
| Date | Buyer | Sale Price | Title Company |
|---|---|---|---|
| Halle Francis J | $310,280 | Chicago Title Insurance | |
| Findlay Britt J | -- | Whatcom Land Title | |
| Findlay Britt J | -- | Whatcom Land Title | |
| Mackenzie Britt J | $186,900 | Whatcom Land Title |
Source: Public Records
Mortgage History
| Date | Status | Borrower | Loan Amount |
|---|---|---|---|
| Open | Halle Francis J | $248,000 | |
| Previous Owner | Mackenzie Britt J | $177,550 |
Source: Public Records
Tax History Compared to Growth
Tax History
| Year | Tax Paid | Tax Assessment Tax Assessment Total Assessment is a certain percentage of the fair market value that is determined by local assessors to be the total taxable value of land and additions on the property. | Land | Improvement |
|---|---|---|---|---|
| 2024 | $6,071 | $753,211 | $354,774 | $398,437 |
| 2023 | $6,071 | $780,140 | $367,458 | $412,682 |
| 2022 | $4,974 | $663,952 | $312,732 | $351,220 |
| 2021 | $4,623 | $535,460 | $252,210 | $283,250 |
| 2020 | $4,540 | $469,698 | $221,235 | $248,463 |
| 2019 | $4,049 | $445,845 | $210,000 | $235,845 |
| 2018 | $4,204 | $398,710 | $176,313 | $222,397 |
| 2017 | $3,704 | $353,911 | $156,500 | $197,411 |
| 2016 | $3,374 | $325,891 | $144,000 | $181,891 |
| 2015 | $3,321 | $309,079 | $136,500 | $172,579 |
| 2014 | -- | $294,354 | $130,000 | $164,354 |
| 2013 | -- | $280,197 | $125,000 | $155,197 |
Source: Public Records
Map
Nearby Homes
- 905 Queen St
- 0 Lopez St
- 1401 Edwards St
- 805 Nevada St
- 115 43rd St
- 143 S 44th St
- 1200 Lincoln St Unit 196
- 1200 Lincoln St Unit 117
- 1200 Lincoln St Unit 154
- 1227 Puget St
- 842 Woodbine Way
- 1501 Lakeway Dr
- 4224 Dumas Ave
- 1142 Whidbey St
- 1146 Whidbey St
- 1101 Whidbey St
- 1356 Orleans St
- 0 Princeton Ct
- 1125 Otis St
- 2496 Yew Street Rd