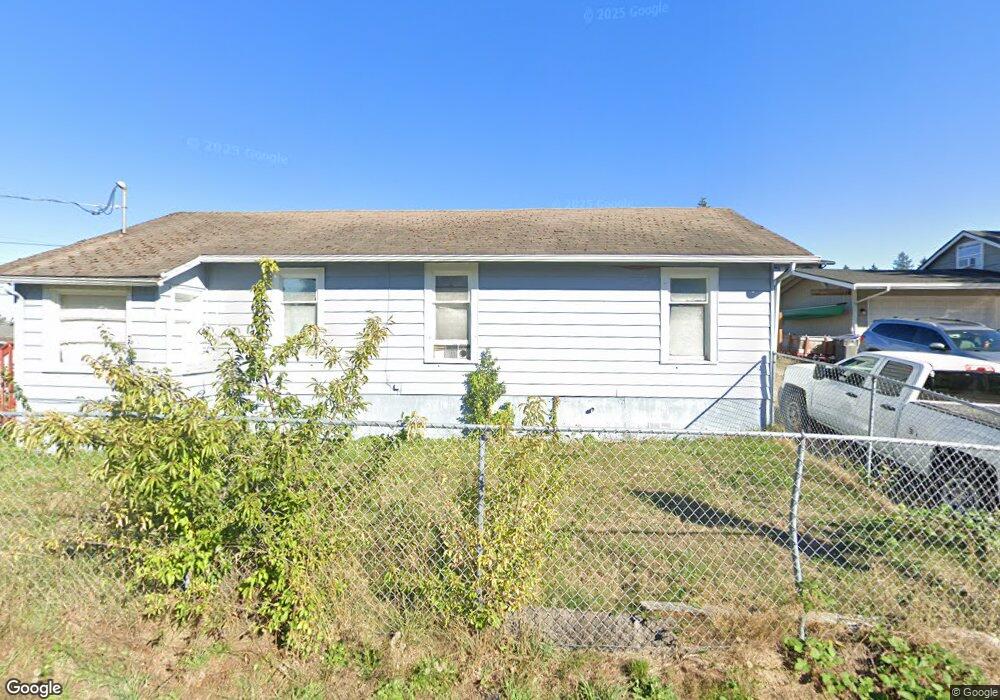
951 Retsil Rd E Port Orchard, WA 98366
Estimated Value: $304,000 - $334,507
2
Beds
1
Bath
820
Sq Ft
$392/Sq Ft
Est. Value
About This Home
This home is located at 951 Retsil Rd E, Port Orchard, WA 98366 and is currently estimated at $321,627, approximately $392 per square foot. 951 Retsil Rd E is a home located in Kitsap County with nearby schools including East Port Orchard Elementary School, Marcus Whitman Middle School, and South Kitsap High School.
Ownership History
Date
Name
Owned For
Owner Type
Purchase Details
Closed on
Aug 18, 2008
Sold by
Lopez Babbette C
Bought by
Lopez Babbette C and Parker Sherry A
Current Estimated Value
Home Financials for this Owner
Home Financials are based on the most recent Mortgage that was taken out on this home.
Original Mortgage
$166,135
Outstanding Balance
$109,253
Interest Rate
6.37%
Mortgage Type
FHA
Estimated Equity
$212,374
Purchase Details
Closed on
Apr 19, 2005
Sold by
Lincoln Trust Co and Simons Trevalene
Bought by
Lopez Babbette C
Home Financials for this Owner
Home Financials are based on the most recent Mortgage that was taken out on this home.
Original Mortgage
$107,100
Interest Rate
6.87%
Mortgage Type
Purchase Money Mortgage
Purchase Details
Closed on
Jun 9, 2003
Sold by
Urlacher Roger Dale and Urlacher Tina L
Bought by
Lincoln Trust Co and Simons Trevalene
Create a Home Valuation Report for This Property
The Home Valuation Report is an in-depth analysis detailing your home's value as well as a comparison with similar homes in the area
Home Values in the Area
Average Home Value in this Area
Purchase History
| Date | Buyer | Sale Price | Title Company |
|---|---|---|---|
| Lopez Babbette C | -- | Transnation Title Ins Co | |
| Lopez Babbette C | $133,900 | Land Title Company | |
| Lincoln Trust Co | $74,900 | Land Title Company |
Source: Public Records
Mortgage History
| Date | Status | Borrower | Loan Amount |
|---|---|---|---|
| Open | Lopez Babbette C | $166,135 | |
| Previous Owner | Lopez Babbette C | $107,100 | |
| Closed | Lopez Babbette C | $26,800 |
Source: Public Records
Tax History Compared to Growth
Tax History
| Year | Tax Paid | Tax Assessment Tax Assessment Total Assessment is a certain percentage of the fair market value that is determined by local assessors to be the total taxable value of land and additions on the property. | Land | Improvement |
|---|---|---|---|---|
| 2026 | $2,132 | $254,470 | $72,670 | $181,800 |
| 2025 | $2,132 | $234,920 | $59,230 | $175,690 |
| 2024 | $2,068 | $234,920 | $59,230 | $175,690 |
| 2023 | $2,053 | $234,920 | $59,230 | $175,690 |
| 2022 | $2,051 | $197,030 | $55,320 | $141,710 |
| 2021 | $1,708 | $153,950 | $51,400 | $102,550 |
| 2020 | $1,681 | $147,360 | $48,950 | $98,410 |
| 2019 | $1,277 | $120,940 | $48,060 | $72,880 |
| 2018 | $1,375 | $104,590 | $48,060 | $56,530 |
| 2017 | $1,210 | $104,590 | $48,060 | $56,530 |
| 2016 | $1,222 | $97,010 | $48,060 | $48,950 |
| 2015 | $1,190 | $95,820 | $48,060 | $47,760 |
| 2014 | -- | $94,620 | $48,060 | $46,560 |
| 2013 | -- | $98,970 | $50,590 | $48,380 |
Source: Public Records
Map
Nearby Homes
- 123 E 4th St
- 343 Farragut Ave N
- 22 Lots E Washington St
- 0 Beach Dr E Unit NWM2448019
- 0 Beach Dr E Unit NWM2139946
- 0 E Washington St Unit NWM2337936
- 3140 E Washington St
- 1811 Bay St
- 130 Mitchell Ave
- 2949 SE Mile Hill Dr Unit C-2
- 190 SE Mile Hill Dr
- 204 Rockwell Ave
- 4990 Mile Hill Dr
- 0 XXX Bay St
- 3817 SE Horstman Rd
- 1341 Salt Point Place E
- 0 Wendell Ave SE
- 4 SE Sinclair View Dr
- 0 Melcher St Unit NWM2458297
- 3589 SE Pine Tree Dr
- 0 E 2nd St Unit NWM1997827
- 2618 E 2nd St
- 925 Retsil Rd E
- 2622 E 2nd St
- 2617 E 3rd St
- 2636 E 2nd St
- 952 Retsil Rd E
- 910 Retsil Rd E
- 942 Retsil Rd E
- 966 Retsil Rd E
- 2631 E 2nd St
- 978 Retsil Rd E
- 2650 E 2nd St
- 2633 E 3rd St
- 2559 E 3rd St
- 990 Edwards Ct E
- 2647 E 3rd St
- 2641 E 2nd St
- 2668 E 2nd St
- 2533 E 3rd St