Estimated Value: $576,938 - $595,000
3
Beds
3
Baths
2,242
Sq Ft
$261/Sq Ft
Est. Value
About This Home
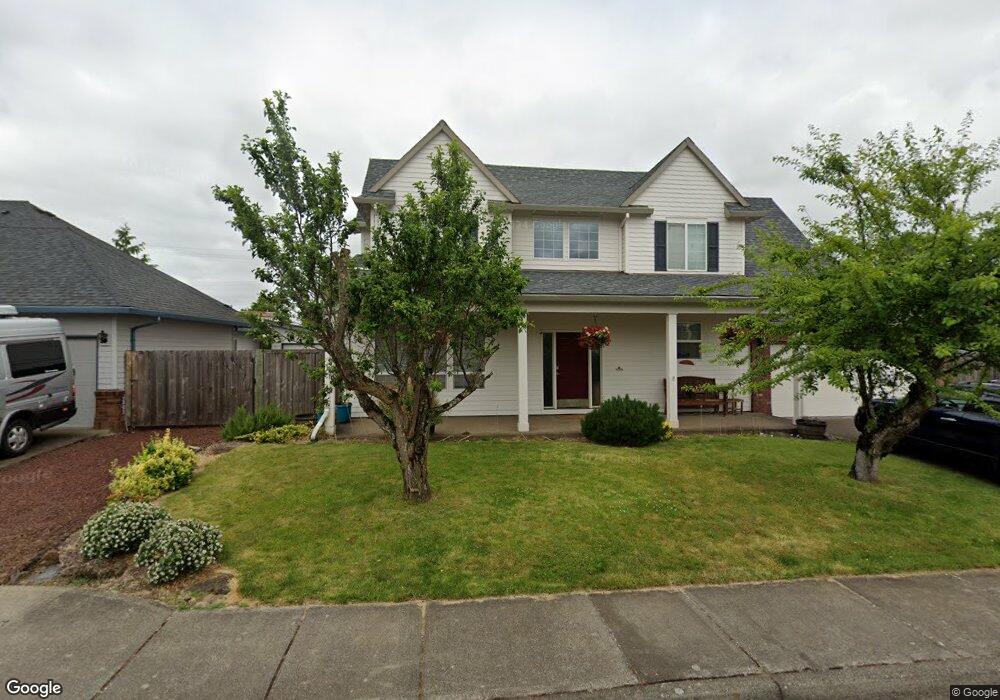
This home is located at 951 S Larch St, Canby, OR 97013 and is currently estimated at $585,235, approximately $261 per square foot. 951 S Larch St is a home located in Clackamas County with nearby schools including Josefa L. Sambrano Elementary School, Philander Lee Elementary School, and Baker Prairie Middle School.
Ownership History
Date
Name
Owned For
Owner Type
Purchase Details
Closed on
Oct 28, 2011
Sold by
Eschen Jeff and Eschen Jessica
Bought by
Hornseth Todd and Hornseth Kristin
Current Estimated Value
Home Financials for this Owner
Home Financials are based on the most recent Mortgage that was taken out on this home.
Original Mortgage
$237,405
Outstanding Balance
$160,619
Interest Rate
4.01%
Mortgage Type
New Conventional
Estimated Equity
$424,616
Purchase Details
Closed on
Nov 28, 2001
Sold by
Wanderscheid Thomas D and Wanderscheid Melinda B
Bought by
Eschen Jeff and Eschen Jessica
Home Financials for this Owner
Home Financials are based on the most recent Mortgage that was taken out on this home.
Original Mortgage
$163,900
Interest Rate
6.63%
Purchase Details
Closed on
Aug 15, 1996
Sold by
Regan Enterprises
Bought by
Kraxberger Melinda B
Create a Home Valuation Report for This Property
The Home Valuation Report is an in-depth analysis detailing your home's value as well as a comparison with similar homes in the area
Home Values in the Area
Average Home Value in this Area
Purchase History
| Date | Buyer | Sale Price | Title Company |
|---|---|---|---|
| Hornseth Todd | $249,900 | Multiple | |
| Eschen Jeff | $204,900 | Chicago Title | |
| Kraxberger Melinda B | $86,500 | Chicago Title Insurance Co |
Source: Public Records
Mortgage History
| Date | Status | Borrower | Loan Amount |
|---|---|---|---|
| Open | Hornseth Todd | $237,405 | |
| Previous Owner | Eschen Jeff | $163,900 |
Source: Public Records
Tax History Compared to Growth
Tax History
| Year | Tax Paid | Tax Assessment Tax Assessment Total Assessment is a certain percentage of the fair market value that is determined by local assessors to be the total taxable value of land and additions on the property. | Land | Improvement |
|---|---|---|---|---|
| 2025 | $5,949 | $335,778 | -- | -- |
| 2024 | $5,782 | $325,999 | -- | -- |
| 2023 | $5,782 | $316,504 | $0 | $0 |
| 2022 | $5,318 | $307,286 | $0 | $0 |
| 2021 | $5,121 | $298,336 | $0 | $0 |
| 2020 | $5,030 | $289,647 | $0 | $0 |
| 2019 | $4,790 | $281,211 | $0 | $0 |
| 2018 | $4,683 | $273,020 | $0 | $0 |
| 2017 | $4,564 | $265,068 | $0 | $0 |
| 2016 | $4,412 | $257,348 | $0 | $0 |
| 2015 | $4,260 | $249,852 | $0 | $0 |
| 2014 | $4,138 | $242,575 | $0 | $0 |
Source: Public Records
Map
Nearby Homes
- 331 SE 9th Ave
- 363 SE 7th Ave
- 387 SE 7th Ave
- 423 SE 7th Ave
- 385 SE Township Rd
- 574 S Ivy St
- 201 SE 16th Ave
- 248 SE Township Rd
- 486 S Knott St
- 481 S Holly St
- 582 S Maple St
- 1491 S Fir St Unit 18
- 1487 S Fir St Unit Lot17
- 1485 S Fir St Unit Lot 16
- 550 SE 5th Ave
- 299 SW 3rd Ave
- 1409 S Maple St
- 575 S Ponderosa St
- 1460 SE 9th Ave
- 431 SW 3rd Ave
- 951 S Do Not Call-No Sell
- 929 S Larch St
- 150 SE 10th Ave
- 204 SE 10th Ave
- 229 SE 9th Ave
- 881 S Larch St
- 954 S Ivy St
- 906 S Ivy St
- 165 SE 10th Ave
- 224 SE 10th Ave
- 253 SE 9th Ave
- 855 S Larch St
- 193 SE 10th Ave
- 234 SE 9th Ave
- 242 SE 10th Ave
- 275 SE 9th Ave
- 262 SE 9th Ave
- 227 SE 10th Ave
- 833 S Larch St
- 125 SW 8th Ave