Estimated Value: $248,993 - $268,000
3
Beds
2
Baths
1,600
Sq Ft
$160/Sq Ft
Est. Value
About This Home
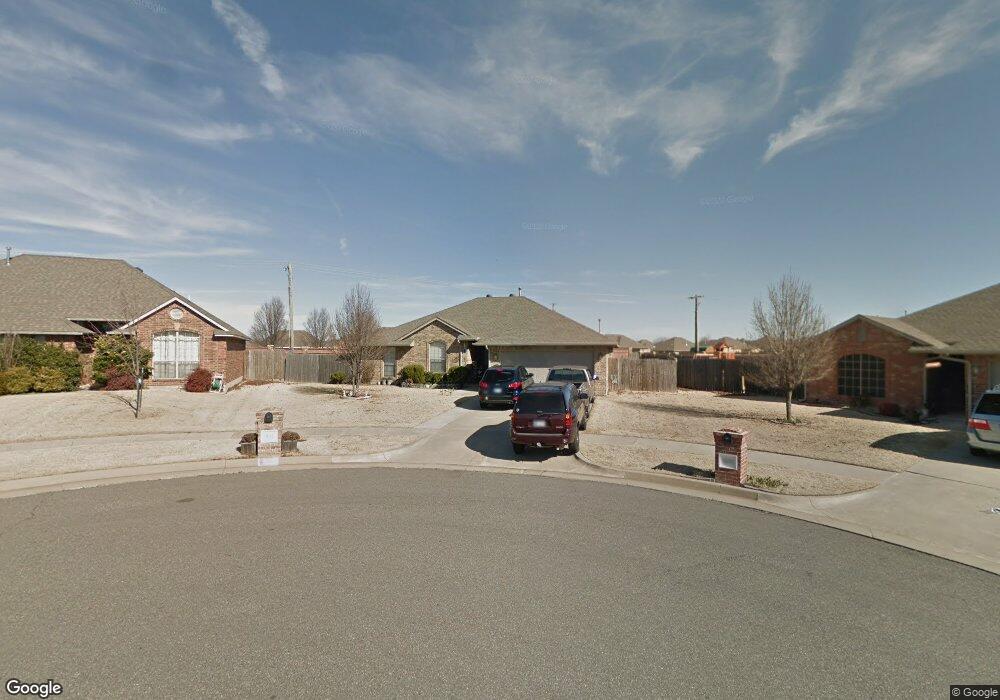
This home is located at 951 SW 35th Place, Moore, OK 73160 and is currently estimated at $256,748, approximately $160 per square foot. 951 SW 35th Place is a home located in Cleveland County with nearby schools including Broadmoore Elementary School, Highland East Junior High School, and Moore High School.
Ownership History
Date
Name
Owned For
Owner Type
Purchase Details
Closed on
Oct 18, 2005
Sold by
Bingham Charles L and Bingham Deana D
Bought by
Bingham Deanna D
Current Estimated Value
Home Financials for this Owner
Home Financials are based on the most recent Mortgage that was taken out on this home.
Original Mortgage
$117,400
Outstanding Balance
$62,560
Interest Rate
5.69%
Mortgage Type
New Conventional
Estimated Equity
$194,188
Purchase Details
Closed on
Oct 13, 2005
Sold by
Renaissance Construction Group Llc
Bought by
Bingham Charles L
Home Financials for this Owner
Home Financials are based on the most recent Mortgage that was taken out on this home.
Original Mortgage
$117,400
Outstanding Balance
$62,560
Interest Rate
5.69%
Mortgage Type
New Conventional
Estimated Equity
$194,188
Purchase Details
Closed on
Apr 28, 2005
Sold by
Renaissance Construction Llc
Bought by
Renaissance Construction Llc
Home Financials for this Owner
Home Financials are based on the most recent Mortgage that was taken out on this home.
Original Mortgage
$107,920
Interest Rate
6.03%
Mortgage Type
Future Advance Clause Open End Mortgage
Create a Home Valuation Report for This Property
The Home Valuation Report is an in-depth analysis detailing your home's value as well as a comparison with similar homes in the area
Home Values in the Area
Average Home Value in this Area
Purchase History
| Date | Buyer | Sale Price | Title Company |
|---|---|---|---|
| Bingham Deanna D | $147,000 | None Available | |
| Bingham Charles L | -- | None Available | |
| Renaissance Construction Llc | -- | None Available |
Source: Public Records
Mortgage History
| Date | Status | Borrower | Loan Amount |
|---|---|---|---|
| Open | Bingham Deanna D | $117,400 | |
| Previous Owner | Renaissance Construction Llc | $107,920 |
Source: Public Records
Tax History Compared to Growth
Tax History
| Year | Tax Paid | Tax Assessment Tax Assessment Total Assessment is a certain percentage of the fair market value that is determined by local assessors to be the total taxable value of land and additions on the property. | Land | Improvement |
|---|---|---|---|---|
| 2024 | $2,125 | $18,515 | $3,749 | $14,766 |
| 2023 | $2,069 | $17,976 | $3,593 | $14,383 |
| 2022 | $2,036 | $17,453 | $4,035 | $13,418 |
| 2021 | $1,982 | $16,944 | $3,903 | $13,041 |
| 2020 | $1,920 | $16,451 | $3,350 | $13,101 |
| 2019 | $1,894 | $15,972 | $2,580 | $13,392 |
| 2018 | $1,895 | $15,972 | $2,580 | $13,392 |
| 2017 | $1,905 | $15,972 | $0 | $0 |
| 2016 | $1,920 | $15,972 | $2,580 | $13,392 |
| 2015 | $1,754 | $16,119 | $2,580 | $13,539 |
| 2014 | $1,855 | $16,621 | $2,640 | $13,981 |
Source: Public Records
Map
Nearby Homes
- 3701 Kensington Dr
- 708 Carol Ann Place
- 813 SW 32nd St
- 805 Brian Ct
- 905 SW 41st St
- 623 SW 37th St
- 3624 Green Apple Place
- 4008 Red Apple Cir
- 4300 Mackenzie Dr
- 4000 Queens Dr
- 101 SE 27th St
- 308 Jeffrey Laird Place
- 4412 Brooklyn Ave
- 809 SW 27th St
- 104 SE 34th St
- 700 SW 45th St
- 2520 Port Rush Dr
- 620 SW 24th St
- 3600 Country Club
- 4515 Baldwin Ave
- 955 SW 35th Place
- 3600 Kensington Dr
- 927 SW 35th St
- 3604 Kensington Dr
- 924 SW 35th St
- 921 SW 35th St
- 3605 Kensington Dr
- 926 SW 35th St
- 832 Carol Ann Place
- 836 Carol Ann Place
- 3608 Kensington Dr
- 828 Carol Ann Place
- 1001 SW 35th Place
- 840 Carol Ann Place
- 3609 Kensington Dr
- 824 Carol Ann Place
- 3604 Notting Hill Dr
- 900 Carol Ann Place
- 922 SW 35th St
- 3700 Kensington Dr