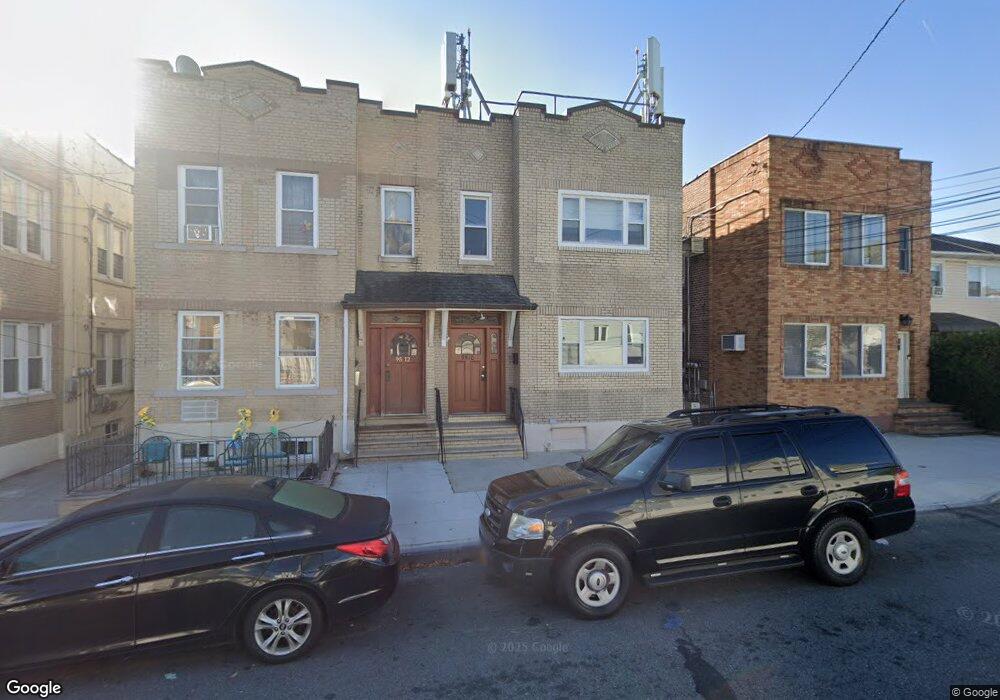
9510 Pitkin Ave Ozone Park, NY 11417
Ozone Park NeighborhoodEstimated Value: $955,000 - $1,196,000
--
Bed
--
Bath
2,764
Sq Ft
$377/Sq Ft
Est. Value
About This Home
This home is located at 9510 Pitkin Ave, Ozone Park, NY 11417 and is currently estimated at $1,042,667, approximately $377 per square foot. 9510 Pitkin Ave is a home located in Queens County with nearby schools including P.S./M.S. 146 Howard Beach, Robert H. Goddard High School, and John Adams High School.
Ownership History
Date
Name
Owned For
Owner Type
Purchase Details
Closed on
Apr 17, 2008
Sold by
P & A Rentals Inc
Bought by
95-10 Pitkin Avenue Llc
Current Estimated Value
Purchase Details
Closed on
Jul 5, 2005
Sold by
Lagano Anthony
Bought by
P & A Rentals Inc
Purchase Details
Closed on
Dec 11, 2002
Sold by
P & A Rental Inc
Bought by
Lagano Anthony
Purchase Details
Closed on
Aug 15, 2002
Sold by
Lagano Anthony and Sonzone Philip
Bought by
P & A Rentals
Purchase Details
Closed on
May 3, 1999
Sold by
Lagano Anthony
Bought by
Lagano Anthony and Sonzone Philip
Purchase Details
Closed on
Nov 12, 1998
Sold by
Russo Millie
Bought by
Lagano Anthony
Home Financials for this Owner
Home Financials are based on the most recent Mortgage that was taken out on this home.
Original Mortgage
$168,750
Interest Rate
6.78%
Create a Home Valuation Report for This Property
The Home Valuation Report is an in-depth analysis detailing your home's value as well as a comparison with similar homes in the area
Home Values in the Area
Average Home Value in this Area
Purchase History
| Date | Buyer | Sale Price | Title Company |
|---|---|---|---|
| 95-10 Pitkin Avenue Llc | -- | -- | |
| 95-10 Pitkin Avenue Llc | -- | -- | |
| P & A Rentals Inc | -- | -- | |
| P & A Rentals Inc | -- | -- | |
| Lagano Anthony | -- | -- | |
| Lagano Anthony | -- | -- | |
| P & A Rentals | -- | -- | |
| P & A Rentals | -- | -- | |
| Lagano Anthony | -- | Commonwealth Land Title Ins | |
| Lagano Anthony | -- | Commonwealth Land Title Ins | |
| Lagano Anthony | $240,000 | -- | |
| Lagano Anthony | $240,000 | -- |
Source: Public Records
Mortgage History
| Date | Status | Borrower | Loan Amount |
|---|---|---|---|
| Previous Owner | Lagano Anthony | $168,750 |
Source: Public Records
Tax History Compared to Growth
Tax History
| Year | Tax Paid | Tax Assessment Tax Assessment Total Assessment is a certain percentage of the fair market value that is determined by local assessors to be the total taxable value of land and additions on the property. | Land | Improvement |
|---|---|---|---|---|
| 2025 | $8,000 | $42,220 | $10,387 | $31,833 |
| 2024 | $8,000 | $39,830 | $10,358 | $29,472 |
| 2023 | $8,089 | $39,830 | $9,918 | $29,912 |
| 2022 | $7,891 | $62,520 | $18,600 | $43,920 |
| 2021 | $7,849 | $51,840 | $18,600 | $33,240 |
| 2020 | $7,447 | $54,540 | $18,600 | $35,940 |
| 2019 | $6,943 | $58,020 | $18,600 | $39,420 |
| 2018 | $6,766 | $33,192 | $11,484 | $21,708 |
| 2017 | $6,715 | $32,942 | $14,085 | $18,857 |
| 2016 | $6,213 | $32,942 | $14,085 | $18,857 |
| 2015 | $4,190 | $29,319 | $18,238 | $11,081 |
| 2014 | $4,190 | $27,660 | $20,640 | $7,020 |
Source: Public Records
Map
Nearby Homes
- 9515 Pitkin Ave
- 96-15 149th Ave
- 95-18 Linden Blvd
- 9003 Albert Rd
- 96-36 149th Ave
- 13723 Lafayette St
- 9704 Pitkin Ave
- 94- 24 Magnolia Ct Unit 3A
- 150-19 95th St Unit 3
- 96-06 134th Rd
- 13319 Crossbay Blvd
- 150-06 Hawtree St
- 90-28 Pitkin Ave Unit 1,2 and 3
- 9439 134th Ave
- 91-25 Gold Rd
- 150-45 Centerville St Unit 3B
- 9149 153rd Ave Unit 123
- 8851 Pitkin Ave
- 89- 25 151st Ave Unit 4S
- 98-29 Albert Rd
- 9508 Pitkin Ave
- 9512 Pitkin Ave
- 9514 Pitkin Ave
- 9504 Pitkin Ave
- 95-16 Pitkin Ave
- 9516 Pitkin Ave
- 9516 Pitkin Ave Unit 2F
- 13711 95th St
- 13711 95th St
- 137-12 96th St
- 13712 96th St
- 13706 96th St
- 13715 95th St
- 137-15 95th St Unit 2nd Fl
- 137-15 95th St
- 13714 96th St
- 13716 96th St
- 13716 96th St
- 13717 95th St
- 13547 95th St