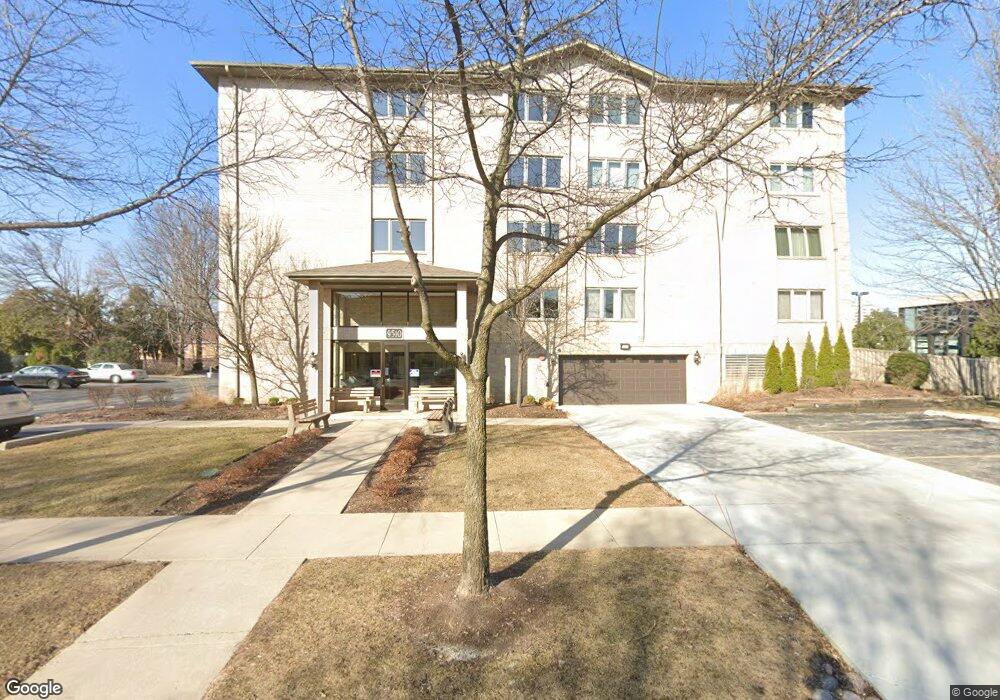
9510 S Kolmar Ave Unit 207 Oak Lawn, IL 60453
Estimated Value: $206,046 - $238,000
2
Beds
2
Baths
1,513
Sq Ft
$145/Sq Ft
Est. Value
About This Home
This home is located at 9510 S Kolmar Ave Unit 207, Oak Lawn, IL 60453 and is currently estimated at $220,012, approximately $145 per square foot. 9510 S Kolmar Ave Unit 207 is a home located in Cook County with nearby schools including Sward Elementary School, J Covington Elementary School, and Hometown Elementary School.
Ownership History
Date
Name
Owned For
Owner Type
Purchase Details
Closed on
Aug 4, 2008
Sold by
Mccarthy Bridget and Skretta Andrew
Bought by
Schlenz Brett
Current Estimated Value
Home Financials for this Owner
Home Financials are based on the most recent Mortgage that was taken out on this home.
Original Mortgage
$140,000
Outstanding Balance
$92,694
Interest Rate
6.51%
Mortgage Type
Unknown
Estimated Equity
$127,318
Purchase Details
Closed on
Feb 26, 2003
Sold by
Statkus Joseph E
Bought by
Mccarthy Bridget
Home Financials for this Owner
Home Financials are based on the most recent Mortgage that was taken out on this home.
Original Mortgage
$129,600
Interest Rate
6%
Mortgage Type
Balloon
Purchase Details
Closed on
Aug 12, 2000
Sold by
Statkus Joyce L
Bought by
Statkus Joseph E and Statkus Joyce L
Purchase Details
Closed on
May 9, 1995
Sold by
Standard Bank & Trust Company
Bought by
Statkus Joyce L
Create a Home Valuation Report for This Property
The Home Valuation Report is an in-depth analysis detailing your home's value as well as a comparison with similar homes in the area
Home Values in the Area
Average Home Value in this Area
Purchase History
| Date | Buyer | Sale Price | Title Company |
|---|---|---|---|
| Schlenz Brett | $175,000 | Cti | |
| Mccarthy Bridget | $162,000 | Cti | |
| Statkus Joseph E | -- | Chicago Title Insurance Co | |
| Statkus Joyce L | $144,500 | Ticor Title Insurance |
Source: Public Records
Mortgage History
| Date | Status | Borrower | Loan Amount |
|---|---|---|---|
| Open | Schlenz Brett | $140,000 | |
| Previous Owner | Mccarthy Bridget | $129,600 |
Source: Public Records
Tax History Compared to Growth
Tax History
| Year | Tax Paid | Tax Assessment Tax Assessment Total Assessment is a certain percentage of the fair market value that is determined by local assessors to be the total taxable value of land and additions on the property. | Land | Improvement |
|---|---|---|---|---|
| 2024 | $3,440 | $14,564 | $780 | $13,784 |
| 2023 | $3,057 | $14,564 | $780 | $13,784 |
| 2022 | $3,057 | $11,493 | $1,249 | $10,244 |
| 2021 | $3,024 | $11,492 | $1,248 | $10,244 |
| 2020 | $3,046 | $11,492 | $1,248 | $10,244 |
| 2019 | $3,151 | $12,119 | $1,144 | $10,975 |
| 2018 | $3,029 | $12,119 | $1,144 | $10,975 |
| 2017 | $3,056 | $12,119 | $1,144 | $10,975 |
| 2016 | $2,914 | $10,452 | $962 | $9,490 |
| 2015 | $2,837 | $10,452 | $962 | $9,490 |
| 2014 | $2,824 | $10,452 | $962 | $9,490 |
| 2013 | $3,365 | $13,088 | $962 | $12,126 |
Source: Public Records
Map
Nearby Homes
- 9510 S Kolmar Ave Unit 406
- 9510 S Kolmar Ave Unit 311
- 9520 S Kenton Ave
- 9526 S Kilbourn Ave
- 9523 S Kostner Ave
- 4560 W 93rd St Unit 2D
- 9516 S Kildare Ave Unit 2N
- 4530 W 93rd St Unit 2B
- 4211 W 95th St Unit 1C
- 9821 S Cicero Ave Unit 8
- 9617 Brandt Ave
- 9246 S 49th Ave
- 9904 S Cicero Ave
- 4320 W 99th Place
- 4501 W 90th Place
- 4125 W 97th Place Unit 206
- 4433 W 100th St
- 9330 S 50th Ave
- 4325 W 99th Place
- 9716 S Karlov Ave Unit 203
- 9510 S Kolmar Ave Unit 108
- 9510 S Kolmar Ave Unit 206
- 9510 S Kolmar Ave Unit 412
- 9510 S Kolmar Ave Unit 312
- 9510 S Kolmar Ave Unit 410
- 9510 S Kolmar Ave Unit 409
- 9510 S Kolmar Ave Unit 301
- 9510 S Kolmar Ave Unit 208
- 9510 S Kolmar Ave Unit 309
- 9510 S Kolmar Ave Unit 306
- 9510 S Kolmar Ave Unit 302
- 9510 S Kolmar Ave Unit 110
- 9510 S Kolmar Ave Unit 104
- 9510 S Kolmar Ave Unit 402
- 9510 S Kolmar Ave Unit 105
- 9510 S Kolmar Ave Unit 109
- 9510 S Kolmar Ave Unit 210
- 9510 S Kolmar Ave Unit 103
- 9510 S Kolmar Ave Unit 201
- 9510 S Kolmar Ave Unit 408