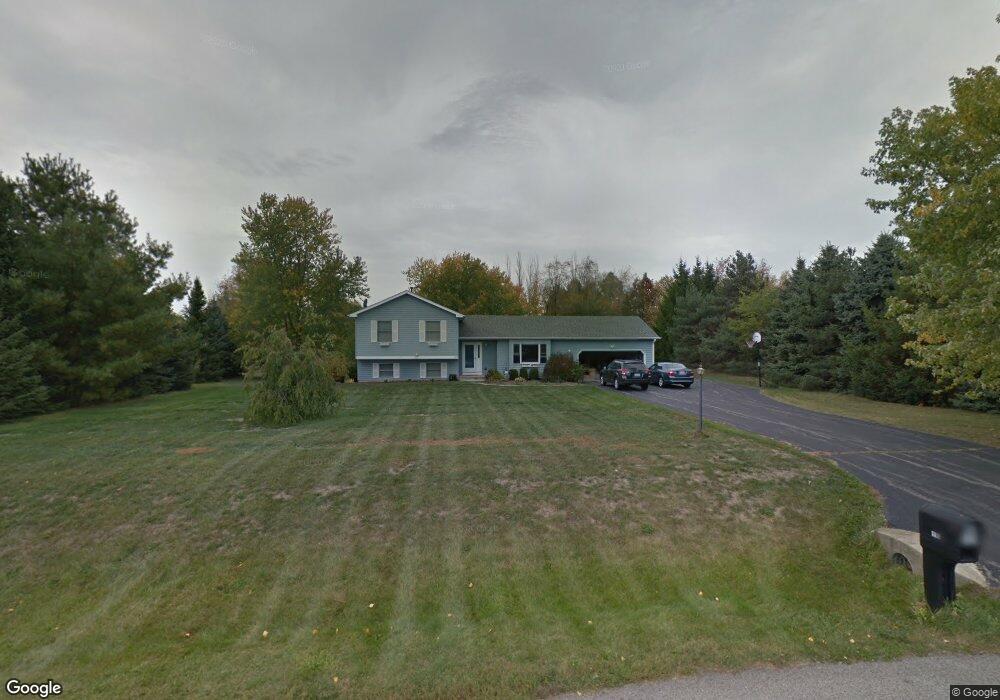
9511 Champion Ct Spring Grove, IL 60081
Estimated Value: $334,075 - $420,000
3
Beds
--
Bath
1,328
Sq Ft
$289/Sq Ft
Est. Value
About This Home
This home is located at 9511 Champion Ct, Spring Grove, IL 60081 and is currently estimated at $383,269, approximately $288 per square foot. 9511 Champion Ct is a home located in McHenry County with nearby schools including Richmond Grade School, Nippersink Middle School, and Richmond-Burton High School.
Ownership History
Date
Name
Owned For
Owner Type
Purchase Details
Closed on
Nov 2, 2005
Sold by
Sullivan Melissa A
Bought by
Sullivan Leo R
Current Estimated Value
Home Financials for this Owner
Home Financials are based on the most recent Mortgage that was taken out on this home.
Original Mortgage
$204,000
Outstanding Balance
$110,748
Interest Rate
5.89%
Mortgage Type
Fannie Mae Freddie Mac
Estimated Equity
$272,521
Purchase Details
Closed on
Apr 6, 2001
Sold by
Stockwell William
Bought by
Sullivan Leo R and Sullivan Melissa A
Home Financials for this Owner
Home Financials are based on the most recent Mortgage that was taken out on this home.
Original Mortgage
$143,200
Interest Rate
7.13%
Purchase Details
Closed on
Jul 31, 1997
Sold by
Stockwell Dawn
Bought by
Stockwell William
Home Financials for this Owner
Home Financials are based on the most recent Mortgage that was taken out on this home.
Original Mortgage
$82,000
Interest Rate
7.71%
Create a Home Valuation Report for This Property
The Home Valuation Report is an in-depth analysis detailing your home's value as well as a comparison with similar homes in the area
Home Values in the Area
Average Home Value in this Area
Purchase History
| Date | Buyer | Sale Price | Title Company |
|---|---|---|---|
| Sullivan Leo R | -- | Chicago Title Insurance Comp | |
| Sullivan Leo R | $179,000 | Universal Title Services Inc | |
| Stockwell William | -- | Chicago Title |
Source: Public Records
Mortgage History
| Date | Status | Borrower | Loan Amount |
|---|---|---|---|
| Open | Sullivan Leo R | $204,000 | |
| Previous Owner | Sullivan Leo R | $143,200 | |
| Previous Owner | Stockwell William | $82,000 | |
| Closed | Sullivan Leo R | $17,900 |
Source: Public Records
Tax History
| Year | Tax Paid | Tax Assessment Tax Assessment Total Assessment is a certain percentage of the fair market value that is determined by local assessors to be the total taxable value of land and additions on the property. | Land | Improvement |
|---|---|---|---|---|
| 2024 | $6,219 | $97,313 | $21,055 | $76,258 |
| 2023 | $5,967 | $88,960 | $19,248 | $69,712 |
| 2022 | $6,732 | $83,726 | $17,331 | $66,395 |
| 2021 | $6,513 | $80,359 | $16,634 | $63,725 |
| 2020 | $6,405 | $77,320 | $16,005 | $61,315 |
| 2019 | $6,327 | $74,836 | $15,491 | $59,345 |
| 2018 | $6,114 | $69,035 | $14,851 | $54,184 |
| 2017 | $6,106 | $65,741 | $14,142 | $51,599 |
| 2016 | $6,000 | $61,636 | $13,259 | $48,377 |
| 2013 | -- | $58,276 | $12,536 | $45,740 |
Source: Public Records
Map
Nearby Homes
- 9510 Martin Dr
- 9436 Bellaire Ln
- 10105 N Clark Rd
- 2102 W Hunters Ln
- 2919 Il Route 173
- 1914 Spring Dale Dr
- 2214 Main Street Rd
- 11013 Serenity Path
- 11101 Serenity Path
- 10905 Breezy Lawn Rd
- 4901 Hill Rd
- 2150 U S 12
- 3013 N US Highway 12
- 9502 Cabernet Ln
- Lt 9 Cabernet Ln
- 3428 Kings Lair Dr
- Lot 65,66,&64 Main Street Rd
- 7416 Briar Ct
- Lot 16 Harding
- 3012 Rolling Oaks Rd
Your Personal Tour Guide
Ask me questions while you tour the home.