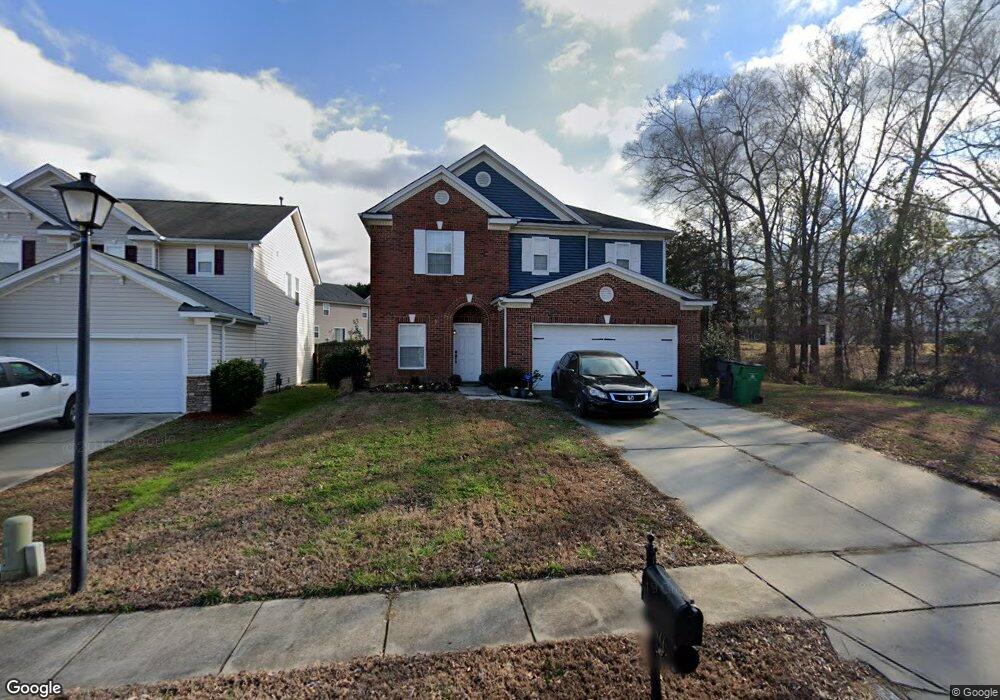
9511 Smooth Path Dr Charlotte, NC 28214
Harwood Lane NeighborhoodEstimated Value: $385,411 - $413,000
3
Beds
3
Baths
2,284
Sq Ft
$174/Sq Ft
Est. Value
About This Home
This home is located at 9511 Smooth Path Dr, Charlotte, NC 28214 and is currently estimated at $396,353, approximately $173 per square foot. 9511 Smooth Path Dr is a home located in Mecklenburg County with nearby schools including River Oaks Academy, Coulwood STEM Academy, and West Mecklenburg High.
Ownership History
Date
Name
Owned For
Owner Type
Purchase Details
Closed on
Aug 18, 2016
Sold by
Wilmnington Savings Fund Society
Bought by
Jones Michael
Current Estimated Value
Home Financials for this Owner
Home Financials are based on the most recent Mortgage that was taken out on this home.
Original Mortgage
$171,690
Outstanding Balance
$136,723
Interest Rate
3.42%
Mortgage Type
New Conventional
Estimated Equity
$259,630
Purchase Details
Closed on
Nov 30, 2015
Sold by
Shaffer Scott D and Miller Kendra M
Bought by
Wilmington Savings Fund Society and Residential Credit Opportunities Trust
Purchase Details
Closed on
Aug 31, 2005
Sold by
Kb Home Charlotte Llc
Bought by
Shaffer Scott D and Miller Kendra M
Home Financials for this Owner
Home Financials are based on the most recent Mortgage that was taken out on this home.
Original Mortgage
$33,728
Interest Rate
5.25%
Mortgage Type
Fannie Mae Freddie Mac
Create a Home Valuation Report for This Property
The Home Valuation Report is an in-depth analysis detailing your home's value as well as a comparison with similar homes in the area
Home Values in the Area
Average Home Value in this Area
Purchase History
| Date | Buyer | Sale Price | Title Company |
|---|---|---|---|
| Jones Michael | $177,000 | None Available | |
| Wilmington Savings Fund Society | $143,000 | None Available | |
| Shaffer Scott D | $169,000 | -- |
Source: Public Records
Mortgage History
| Date | Status | Borrower | Loan Amount |
|---|---|---|---|
| Open | Jones Michael | $171,690 | |
| Previous Owner | Shaffer Scott D | $33,728 | |
| Previous Owner | Shaffer Scott D | $134,912 |
Source: Public Records
Tax History Compared to Growth
Tax History
| Year | Tax Paid | Tax Assessment Tax Assessment Total Assessment is a certain percentage of the fair market value that is determined by local assessors to be the total taxable value of land and additions on the property. | Land | Improvement |
|---|---|---|---|---|
| 2025 | $2,873 | $359,200 | $75,000 | $284,200 |
| 2024 | $2,873 | $359,200 | $75,000 | $284,200 |
| 2023 | $2,774 | $359,200 | $75,000 | $284,200 |
| 2022 | $2,047 | $199,100 | $30,000 | $169,100 |
| 2021 | $2,036 | $199,100 | $30,000 | $169,100 |
| 2020 | $2,028 | $199,100 | $30,000 | $169,100 |
| 2019 | $2,013 | $199,100 | $30,000 | $169,100 |
| 2018 | $1,957 | $143,600 | $22,500 | $121,100 |
| 2017 | $1,922 | $143,600 | $22,500 | $121,100 |
| 2016 | $1,912 | $143,600 | $22,500 | $121,100 |
| 2015 | $1,901 | $143,600 | $22,500 | $121,100 |
| 2014 | $1,906 | $143,600 | $22,500 | $121,100 |
Source: Public Records
Map
Nearby Homes
- 10621 Shanon Darby Ln
- 4110 Dillingham Ct
- 9314 Mountain Aire Cir
- 9439 Brighthaven Ln
- 2430 Mount Holly-Huntersville Rd
- 2725 Monarch Dr
- 10636 Secret Garden Ln
- 9512 Brighthaven Ln
- 1702 Bray Dr
- 10213 Old Carolina Dr
- 11004 Dipali Ct
- 10925 Lassen Ct
- 1635 Bear Mountain Rd
- 10002 Travis Floyd Ln
- 10506 Carver Falls Rd
- 1815 Sugar Hollow Dr
- 10304 Shady Rest Ln
- 2127 Newhart Rd
- 9649 Long Hill Dr
- 1607 Hart Rd
- 9738 Harwood Ln
- 9738 Harwood Ln
- 9507 Smooth Path Dr
- 9510 Smooth Path Dr
- 2419 Harwood Hills Ln
- 2415 Harwood Hills Ln
- 2331 Harwood Hills Ln
- 9506 Smooth Path Dr
- 2405 Harwood Hills Ln
- 2429 Harwood Hills Ln
- 2327 Harwood Hills Ln
- 2323 Harwood Hills Ln
- 2433 Harwood Hills Ln
- 2437 Harwood Hills Ln
- 2317 Harwood Hills Ln
- 2422 Harwood Hills Ln
- 2422 Harwood Hills Ln Unit 28
- 2414 Harwood Hills Ln
- 2426 Harwood Hills Ln
- 2441 Harwood Hills Ln