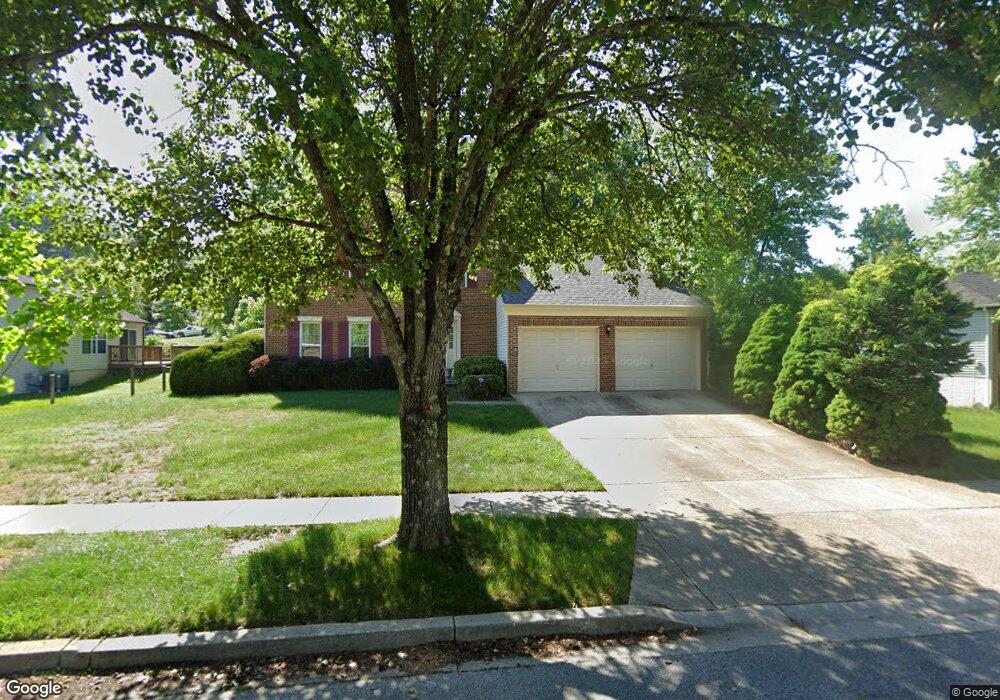
9513 Fox Run Dr Clinton, MD 20735
Estimated Value: $422,000 - $478,000
Studio
3
Baths
1,596
Sq Ft
$285/Sq Ft
Est. Value
About This Home
This home is located at 9513 Fox Run Dr, Clinton, MD 20735 and is currently estimated at $454,215, approximately $284 per square foot. 9513 Fox Run Dr is a home located in Prince George's County with nearby schools including Francis T. Evans Elementary School, Stephen Decatur Middle School, and Dr. Henry A. Wise Jr. High School.
Ownership History
Date
Name
Owned For
Owner Type
Purchase Details
Closed on
Jan 31, 2017
Bought by
Moton Renee
Current Estimated Value
Home Financials for this Owner
Home Financials are based on the most recent Mortgage that was taken out on this home.
Original Mortgage
$308,516
Outstanding Balance
$254,752
Interest Rate
4.19%
Estimated Equity
$199,463
Purchase Details
Closed on
Apr 9, 2010
Sold by
Pruitt Terry L and Pruitt Joyce R
Bought by
Pruitt Terry L
Home Financials for this Owner
Home Financials are based on the most recent Mortgage that was taken out on this home.
Original Mortgage
$220,800
Interest Rate
5.02%
Mortgage Type
Stand Alone Second
Purchase Details
Closed on
Apr 9, 1997
Sold by
Talley Gregory B
Bought by
Pruitt Terry L and Pruitt Joyce R
Purchase Details
Closed on
Sep 14, 1987
Sold by
Costain Washington
Bought by
Talley Gregory B and Talley Alethea E
Create a Home Valuation Report for This Property
The Home Valuation Report is an in-depth analysis detailing your home's value as well as a comparison with similar homes in the area
Home Values in the Area
Average Home Value in this Area
Purchase History
| Date | Buyer | Sale Price | Title Company |
|---|---|---|---|
| Moton Renee | -- | -- | |
| Pruitt Terry L | -- | -- | |
| Pruitt Terry L | $163,900 | -- | |
| Talley Gregory B | $130,600 | -- |
Source: Public Records
Mortgage History
| Date | Status | Borrower | Loan Amount |
|---|---|---|---|
| Open | Moton Renee | $308,516 | |
| Closed | Moton Renee | -- | |
| Previous Owner | Pruitt Terry L | $220,800 |
Source: Public Records
Tax History
| Year | Tax Paid | Tax Assessment Tax Assessment Total Assessment is a certain percentage of the fair market value that is determined by local assessors to be the total taxable value of land and additions on the property. | Land | Improvement |
|---|---|---|---|---|
| 2025 | $4,810 | $385,000 | $116,100 | $268,900 |
| 2024 | $4,810 | $361,167 | -- | -- |
| 2023 | $4,616 | $337,333 | $0 | $0 |
| 2022 | $4,377 | $313,500 | $101,100 | $212,400 |
| 2021 | $4,189 | $298,767 | $0 | $0 |
| 2020 | $4,094 | $284,033 | $0 | $0 |
| 2019 | $3,977 | $269,300 | $100,500 | $168,800 |
| 2018 | $3,863 | $259,433 | $0 | $0 |
| 2017 | $3,772 | $249,567 | $0 | $0 |
| 2016 | -- | $239,700 | $0 | $0 |
| 2015 | $3,295 | $236,733 | $0 | $0 |
| 2014 | $3,295 | $233,767 | $0 | $0 |
Source: Public Records
Map
Nearby Homes
- 9613 Quiet Brook Ln
- 7502 Milligan Ln
- 7408 Milligan Ln
- 9745 Quiet Brook Ln
- 8108 Sonar Rd
- 9602 Stuart Ln
- 9915 Quiet Brook Ln
- 7804 New Ascot Ln
- 10104 Dangerfield Rd
- 8719 Brazke Ct
- 9917 Raintree Way
- 9401 Cheltenham Ave
- 9200 Pine View Ln
- 9601 Hale Dr
- 6706 Surratts Rd
- 7106 Firebrush Ct
- 7202 Redwood Branch Ct
- 10523 Moores Ln
- 7002 Killarney St
- 8013 Poplar Hill Dr
- 7606 Huntsman Ct
- 9511 Fox Run Dr
- 7604 Huntsman Ct
- 7603 Fox Hunt Ct
- 9514 Fox Run Dr
- 9516 Fox Run Dr
- 7605 Fox Hunt Ct
- 9600 Fox Run Dr
- 7605 Huntsman Ct
- 7601 Fox Hunt Ct
- 7602 Huntsman Ct
- 9512 Fox Run Dr
- 7603 Huntsman Ct
- 9508 Fox Run Dr
- 9603 Fox Run Dr
- 7606 Fox Hunt Ct
- 7600 Huntsman Ct
- 7601 Huntsman Ct
- 7600 Fox Hunt Ct
- 7604 Fox Hunt Ct
Your Personal Tour Guide
Ask me questions while you tour the home.