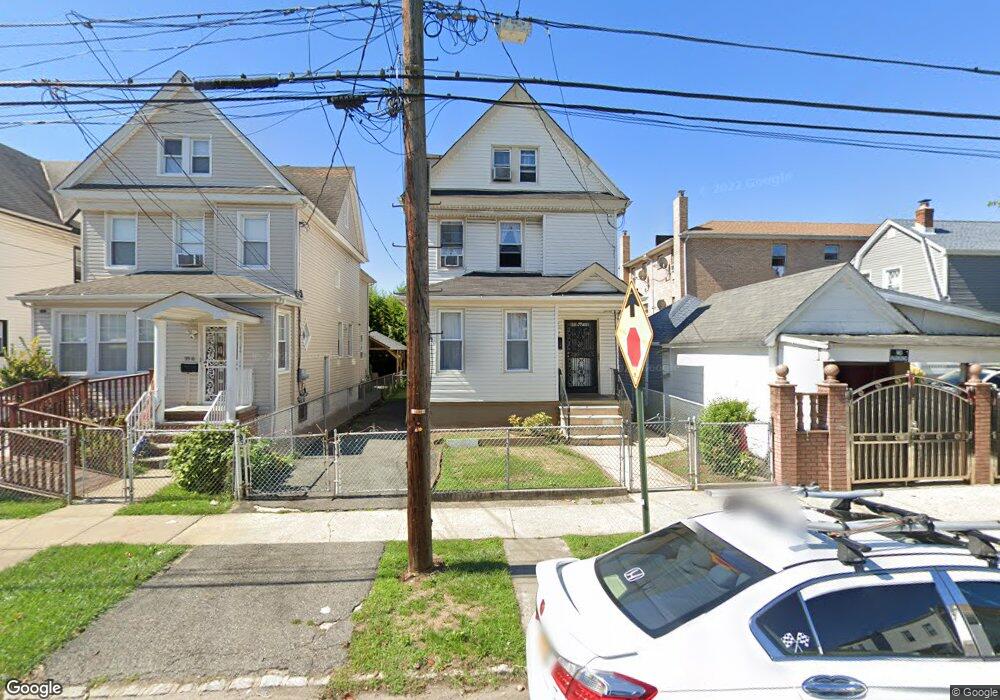
9514 108th St South Richmond Hill, NY 11419
Richmond Hill NeighborhoodEstimated Value: $712,000 - $837,000
--
Bed
--
Bath
1,457
Sq Ft
$515/Sq Ft
Est. Value
About This Home
This home is located at 9514 108th St, South Richmond Hill, NY 11419 and is currently estimated at $749,819, approximately $514 per square foot. 9514 108th St is a home located in Queens County with nearby schools including P.S. 62 - Chester Park, M.S.137 America's School of Heroes, and Richmond Hill High School.
Ownership History
Date
Name
Owned For
Owner Type
Purchase Details
Closed on
Sep 14, 2021
Sold by
Awadh Savitri and Ramlakhan Soeresh
Bought by
Deoki Deeona
Current Estimated Value
Purchase Details
Closed on
Jul 20, 2021
Sold by
Pichardo Ruben and Torres Frank
Bought by
Awadh Savitri and Ramlakhan Soeresh
Purchase Details
Closed on
Mar 31, 2009
Sold by
Pichardo Ruben
Bought by
Pichardo Ruben and Torres Frank
Purchase Details
Closed on
Oct 29, 1998
Sold by
Subick Lilowatie
Bought by
Awadh Savitri and Ramlakhan Soeresh
Home Financials for this Owner
Home Financials are based on the most recent Mortgage that was taken out on this home.
Original Mortgage
$152,650
Interest Rate
6.89%
Mortgage Type
FHA
Purchase Details
Closed on
Sep 25, 1996
Sold by
Glynn Johanna
Bought by
Subick Lilowatie
Home Financials for this Owner
Home Financials are based on the most recent Mortgage that was taken out on this home.
Original Mortgage
$141,300
Interest Rate
7.99%
Create a Home Valuation Report for This Property
The Home Valuation Report is an in-depth analysis detailing your home's value as well as a comparison with similar homes in the area
Home Values in the Area
Average Home Value in this Area
Purchase History
| Date | Buyer | Sale Price | Title Company |
|---|---|---|---|
| Deoki Deeona | $600,000 | -- | |
| Awadh Savitri | -- | -- | |
| Pichardo Ruben | -- | -- | |
| Awadh Savitri | $187,000 | Stewart Title Insurance Co | |
| Subick Lilowatie | $157,000 | Chicago Title Insurance Co |
Source: Public Records
Mortgage History
| Date | Status | Borrower | Loan Amount |
|---|---|---|---|
| Previous Owner | Awadh Savitri | $152,650 | |
| Previous Owner | Subick Lilowatie | $141,300 |
Source: Public Records
Tax History Compared to Growth
Tax History
| Year | Tax Paid | Tax Assessment Tax Assessment Total Assessment is a certain percentage of the fair market value that is determined by local assessors to be the total taxable value of land and additions on the property. | Land | Improvement |
|---|---|---|---|---|
| 2025 | $6,738 | $35,558 | $8,493 | $27,065 |
| 2024 | $6,738 | $33,546 | $9,507 | $24,039 |
| 2023 | $6,357 | $31,649 | $9,634 | $22,015 |
| 2022 | $5,640 | $36,960 | $11,580 | $25,380 |
| 2021 | $6,263 | $38,820 | $11,580 | $27,240 |
| 2020 | $6,272 | $36,420 | $11,580 | $24,840 |
| 2019 | $5,848 | $39,120 | $11,580 | $27,540 |
| 2018 | $5,376 | $26,374 | $7,712 | $18,662 |
| 2017 | $5,072 | $24,883 | $9,984 | $14,899 |
| 2016 | $4,958 | $24,883 | $9,984 | $14,899 |
| 2015 | $2,831 | $24,693 | $12,640 | $12,053 |
| 2014 | $2,831 | $23,296 | $11,130 | $12,166 |
Source: Public Records
Map
Nearby Homes