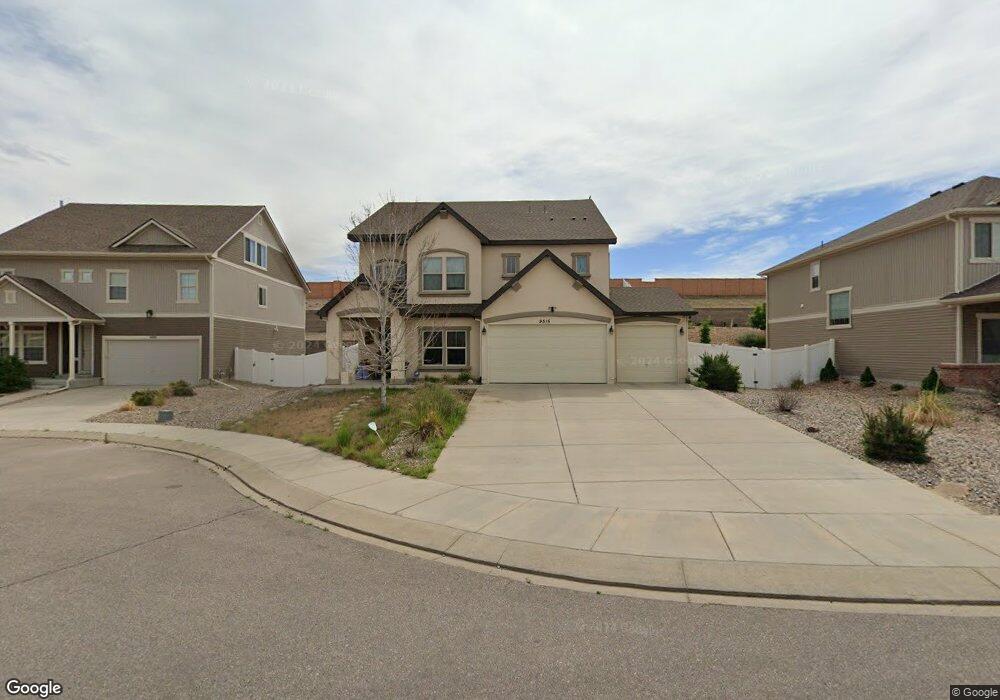
9515 Linkage Trail Fountain, CO 80817
Central Fountain Valley NeighborhoodEstimated Value: $532,324 - $574,000
5
Beds
4
Baths
3,404
Sq Ft
$160/Sq Ft
Est. Value
About This Home
This home is located at 9515 Linkage Trail, Fountain, CO 80817 and is currently estimated at $545,831, approximately $160 per square foot. 9515 Linkage Trail is a home located in El Paso County with nearby schools including Eagleside Elementary School, Fountain Middle School, and Fountain-Fort Carson High School.
Ownership History
Date
Name
Owned For
Owner Type
Purchase Details
Closed on
Sep 15, 2020
Sold by
Francis Kevin
Bought by
Ku Eli L and Ku Alonna Jane
Current Estimated Value
Home Financials for this Owner
Home Financials are based on the most recent Mortgage that was taken out on this home.
Original Mortgage
$403,750
Outstanding Balance
$357,637
Interest Rate
2.8%
Mortgage Type
New Conventional
Estimated Equity
$188,194
Purchase Details
Closed on
Dec 28, 2017
Sold by
Graybill Gary Lynn and Graybill Darlene Kathryn
Bought by
Francis Kevin
Home Financials for this Owner
Home Financials are based on the most recent Mortgage that was taken out on this home.
Original Mortgage
$363,682
Interest Rate
3.92%
Mortgage Type
VA
Purchase Details
Closed on
Aug 18, 2014
Sold by
Oakwood Homes Llc
Bought by
Graybill Gary Lynn and Graybill Darlene Kathryn
Home Financials for this Owner
Home Financials are based on the most recent Mortgage that was taken out on this home.
Original Mortgage
$335,385
Interest Rate
4.16%
Mortgage Type
VA
Create a Home Valuation Report for This Property
The Home Valuation Report is an in-depth analysis detailing your home's value as well as a comparison with similar homes in the area
Home Values in the Area
Average Home Value in this Area
Purchase History
| Date | Buyer | Sale Price | Title Company |
|---|---|---|---|
| Ku Eli L | $425,000 | Unified Title Co | |
| Francis Kevin | $348,000 | Fidelity National Title | |
| Graybill Gary Lynn | $335,400 | Stewart Title |
Source: Public Records
Mortgage History
| Date | Status | Borrower | Loan Amount |
|---|---|---|---|
| Open | Ku Eli L | $403,750 | |
| Previous Owner | Francis Kevin | $363,682 | |
| Previous Owner | Graybill Gary Lynn | $335,385 |
Source: Public Records
Tax History Compared to Growth
Tax History
| Year | Tax Paid | Tax Assessment Tax Assessment Total Assessment is a certain percentage of the fair market value that is determined by local assessors to be the total taxable value of land and additions on the property. | Land | Improvement |
|---|---|---|---|---|
| 2025 | $3,452 | $36,640 | -- | -- |
| 2024 | $3,276 | $35,740 | $4,340 | $31,400 |
| 2022 | $3,026 | $28,730 | $3,430 | $25,300 |
| 2021 | $2,946 | $29,560 | $3,530 | $26,030 |
| 2020 | $2,706 | $26,840 | $3,090 | $23,750 |
| 2019 | $2,678 | $26,840 | $3,090 | $23,750 |
| 2018 | $2,695 | $25,750 | $3,110 | $22,640 |
| 2017 | $2,678 | $25,750 | $3,110 | $22,640 |
| 2016 | $2,700 | $25,950 | $3,220 | $22,730 |
| 2015 | $2,702 | $25,950 | $3,220 | $22,730 |
| 2014 | $46 | $5,950 | $5,950 | $0 |
Source: Public Records
Map
Nearby Homes
- 9673 Pinpoint Dr
- 8170 Watchmen Rd
- Olive Plan at Aspen Ranch
- Lilac Plan at Aspen Ranch
- Juniper Plan at Aspen Ranch
- Fir Plan at Aspen Ranch
- Balsam Plan at Aspen Ranch
- Boxelder Plan at Aspen Ranch
- Elm Plan at Aspen Ranch
- 8045 Firecracker Trail
- 9444 Castle Oaks Dr
- 9709 Lackawanna St
- 9719 Lackawanna St
- 9729 Lackawanna St
- 7963 Bonfire Trail
- 9749 Lackawanna St
- 7934 Campground Dr
- 9769 Lackawanna St
- 7948 Enclave Ln
- 9791 Blaurock Dr
- 9525 Linkage Trail
- 9505 Linkage Trail
- 9535 Linkage Trail
- 9215 Castle Oaks Dr
- 9204 Castle Oaks Dr
- 9545 Linkage Trail
- 9214 Castle Oaks Dr
- 9225 Castle Oaks Dr
- 9555 Linkage Trail
- 8274 Campground Dr
- 9235 Castle Oaks Dr
- 9234 Castle Oaks Dr
- 8264 Campground Dr
- 9245 Castle Oaks Dr
- 9244 Castle Oaks Dr
- 8254 Campground Dr
- 8244 Campground Dr
- 9575 Linkage Trail
- 9255 Castle Oaks Dr
- 9254 Castle Oaks Dr