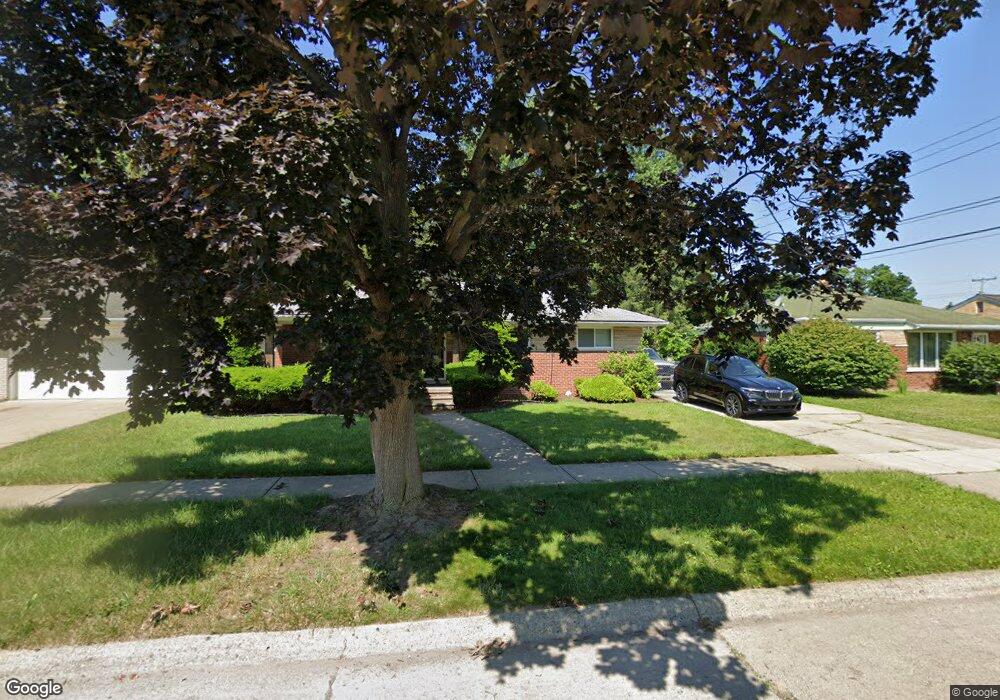
9515 Salem Redford, MI 48239
Estimated Value: $192,000 - $232,000
3
Beds
1
Bath
1,175
Sq Ft
$180/Sq Ft
Est. Value
About This Home
This home is located at 9515 Salem, Redford, MI 48239 and is currently estimated at $211,499, approximately $179 per square foot. 9515 Salem is a home located in Wayne County with nearby schools including John D. Pierce Middle School, Lee M. Thurston High School, and Global Heights Academy.
Ownership History
Date
Name
Owned For
Owner Type
Purchase Details
Closed on
Dec 7, 2009
Sold by
Donovan Shaun and Secretary Of Housing & Urban D
Bought by
Williams Lajuan
Current Estimated Value
Purchase Details
Closed on
May 15, 2009
Sold by
National City Real Estate Services Llc
Bought by
The Secretary Of Housing & Urban Develop
Purchase Details
Closed on
Nov 12, 2008
Sold by
Magee Terry
Bought by
National City Mortgage Co
Purchase Details
Closed on
Mar 13, 2008
Sold by
Majec Terry
Bought by
Majec Shantel H
Create a Home Valuation Report for This Property
The Home Valuation Report is an in-depth analysis detailing your home's value as well as a comparison with similar homes in the area
Home Values in the Area
Average Home Value in this Area
Purchase History
| Date | Buyer | Sale Price | Title Company |
|---|---|---|---|
| Williams Lajuan | $59,001 | Fidelity National Title | |
| The Secretary Of Housing & Urban Develop | -- | None Available | |
| National City Mortgage Co | $134,188 | None Available | |
| Majec Shantel H | -- | None Available |
Source: Public Records
Tax History Compared to Growth
Tax History
| Year | Tax Paid | Tax Assessment Tax Assessment Total Assessment is a certain percentage of the fair market value that is determined by local assessors to be the total taxable value of land and additions on the property. | Land | Improvement |
|---|---|---|---|---|
| 2025 | $884 | $99,300 | $0 | $0 |
| 2024 | $884 | $92,500 | $0 | $0 |
| 2023 | $846 | $80,000 | $0 | $0 |
| 2022 | $2,460 | $68,600 | $0 | $0 |
| 2021 | $2,390 | $64,500 | $0 | $0 |
| 2020 | $2,358 | $59,000 | $0 | $0 |
| 2019 | $2,307 | $51,100 | $0 | $0 |
| 2018 | $762 | $42,800 | $0 | $0 |
| 2017 | $2,636 | $39,700 | $0 | $0 |
| 2016 | $2,054 | $41,000 | $0 | $0 |
| 2015 | $3,200 | $37,800 | $0 | $0 |
| 2013 | $3,100 | $31,600 | $0 | $0 |
| 2012 | $1,956 | $35,100 | $8,700 | $26,400 |
Source: Public Records
Map
Nearby Homes