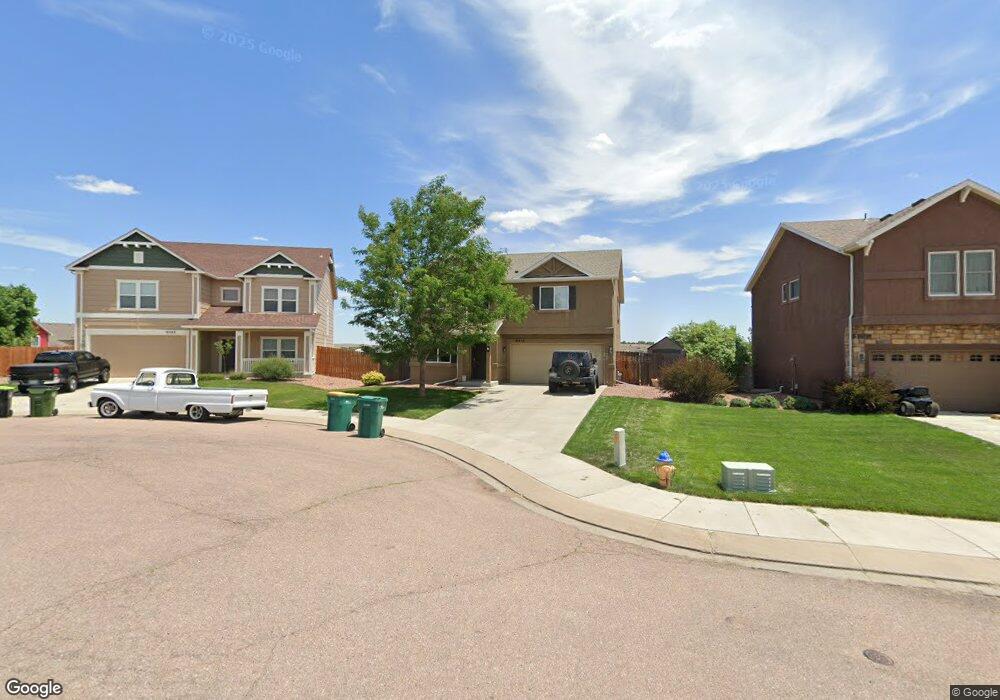
9515 Wind River Ct Fountain, CO 80817
North Fountain Valley NeighborhoodEstimated Value: $443,000 - $497,000
3
Beds
3
Baths
2,282
Sq Ft
$205/Sq Ft
Est. Value
About This Home
This home is located at 9515 Wind River Ct, Fountain, CO 80817 and is currently estimated at $467,963, approximately $205 per square foot. 9515 Wind River Ct is a home with nearby schools including Eagleside Elementary School, Fountain Middle School, and Fountain-Fort Carson High School.
Ownership History
Date
Name
Owned For
Owner Type
Purchase Details
Closed on
Mar 1, 2018
Sold by
Kujath Calvin and Kujath Cristina Sue
Bought by
Porter Joseph
Current Estimated Value
Home Financials for this Owner
Home Financials are based on the most recent Mortgage that was taken out on this home.
Original Mortgage
$307,834
Outstanding Balance
$261,630
Interest Rate
4.04%
Mortgage Type
VA
Estimated Equity
$206,333
Purchase Details
Closed on
Mar 23, 2012
Sold by
Kujath Calvin
Bought by
Kujath Christina Sue
Home Financials for this Owner
Home Financials are based on the most recent Mortgage that was taken out on this home.
Original Mortgage
$221,971
Interest Rate
3.9%
Mortgage Type
VA
Purchase Details
Closed on
Jan 5, 2012
Sold by
Ch Development
Bought by
Challenger Homes Inc
Home Financials for this Owner
Home Financials are based on the most recent Mortgage that was taken out on this home.
Original Mortgage
$1,000,000
Interest Rate
4.02%
Mortgage Type
Credit Line Revolving
Create a Home Valuation Report for This Property
The Home Valuation Report is an in-depth analysis detailing your home's value as well as a comparison with similar homes in the area
Home Values in the Area
Average Home Value in this Area
Purchase History
| Date | Buyer | Sale Price | Title Company |
|---|---|---|---|
| Porter Joseph | $298,000 | Unified Title Company | |
| Kujath Christina Sue | -- | None Available | |
| Kujath Calving | $217,300 | None Available | |
| Challenger Homes Inc | -- | None Available |
Source: Public Records
Mortgage History
| Date | Status | Borrower | Loan Amount |
|---|---|---|---|
| Open | Porter Joseph | $307,834 | |
| Previous Owner | Kujath Calving | $221,971 | |
| Previous Owner | Challenger Homes Inc | $1,000,000 |
Source: Public Records
Tax History Compared to Growth
Tax History
| Year | Tax Paid | Tax Assessment Tax Assessment Total Assessment is a certain percentage of the fair market value that is determined by local assessors to be the total taxable value of land and additions on the property. | Land | Improvement |
|---|---|---|---|---|
| 2025 | $1,660 | $29,860 | -- | -- |
| 2024 | $1,495 | $31,120 | $4,820 | $26,300 |
| 2022 | $1,301 | $22,300 | $3,820 | $18,480 |
| 2021 | $1,208 | $22,940 | $3,930 | $19,010 |
| 2020 | $1,171 | $21,770 | $3,430 | $18,340 |
| 2019 | $1,149 | $21,770 | $3,430 | $18,340 |
| 2018 | $980 | $17,930 | $3,460 | $14,470 |
| 2017 | $968 | $17,930 | $3,460 | $14,470 |
| 2016 | $976 | $18,050 | $3,580 | $14,470 |
| 2015 | $977 | $18,050 | $3,580 | $14,470 |
| 2014 | $891 | $16,550 | $3,580 | $12,970 |
Source: Public Records
Map
Nearby Homes
- 7452 Wind Haven Trail
- 7431 Willow Pines Place
- 7420 Wind Haven Trail
- 7544 Lake Ave
- 7370 Tributary Ct
- 7708 Firecracker Trail
- 609 Wheat Field Rd
- 7327 Willow Pines Place
- 7788 Candlelight Ln
- 704 Rye Ridge Rd
- 601 Harvest Field Way
- 100 Fence Post Ct
- 7326 Legacy Point
- 9223 Waters Edge Dr
- 541 Autumn Place
- 7948 Enclave Ln
- 7860 Lantern Ln
- 7901 Whistlestop Ln
- 700 Autumn Place
- 7861 Lantern Ln
- 9503 Wind River Ct
- 9539 Wind River Ct
- 7650 Dellwood Ln
- 7640 Dellwood Ln
- 9551 Wind River Ct
- 7631 Dellwood Ln
- 7499 Wind Haven Trail
- 7491 Wind Haven Trail
- 9563 Wind River Ct
- 9538 Wind River Ct
- 7483 Wind Haven Trail
- 7621 Dellwood Ln
- 7475 Wind Haven Trail
- 7620 Dellwood Ln
- 9562 Wind River Ct
- 7467 Wind Haven Trail
- 7611 Dellwood Ln
- 9575 Wind River Ct
- 9574 Wind River Ct
- 7610 Dellwood Ln