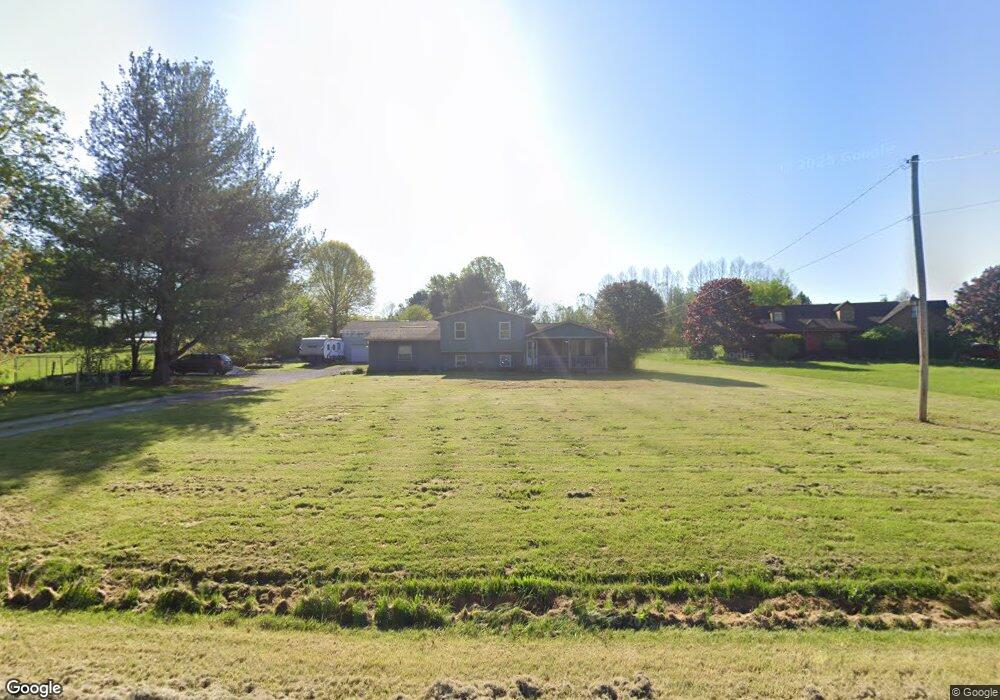
9518 Colton Rd Windham, OH 44288
Estimated Value: $185,000 - $237,000
3
Beds
2
Baths
1,256
Sq Ft
$171/Sq Ft
Est. Value
About This Home
This home is located at 9518 Colton Rd, Windham, OH 44288 and is currently estimated at $214,476, approximately $170 per square foot. 9518 Colton Rd is a home located in Portage County with nearby schools including Katherine Thomas Elementary School, Windham Junior High School, and Windham High School.
Ownership History
Date
Name
Owned For
Owner Type
Purchase Details
Closed on
Apr 30, 2019
Sold by
Franckowiak Irene L
Bought by
Poling David A
Current Estimated Value
Home Financials for this Owner
Home Financials are based on the most recent Mortgage that was taken out on this home.
Original Mortgage
$142,373
Outstanding Balance
$126,904
Interest Rate
5.5%
Mortgage Type
FHA
Estimated Equity
$87,572
Purchase Details
Closed on
Jul 27, 2018
Sold by
Franckowiak Bryan V
Bought by
Franckowiak Bryan V and Franckowiak Irene L
Purchase Details
Closed on
Jan 27, 2014
Sold by
Franckowiak Irene L
Bought by
Franckowiak Bryan
Home Financials for this Owner
Home Financials are based on the most recent Mortgage that was taken out on this home.
Original Mortgage
$86,000
Interest Rate
4.55%
Mortgage Type
New Conventional
Create a Home Valuation Report for This Property
The Home Valuation Report is an in-depth analysis detailing your home's value as well as a comparison with similar homes in the area
Purchase History
| Date | Buyer | Sale Price | Title Company |
|---|---|---|---|
| Poling David A | $145,000 | Diamond Title Co | |
| Franckowiak Bryan V | -- | Commonwealth Suburban Title | |
| Franckowiak Bryan | -- | Pro Source Title Agency Llc |
Source: Public Records
Mortgage History
| Date | Status | Borrower | Loan Amount |
|---|---|---|---|
| Open | Poling David A | $142,373 | |
| Previous Owner | Franckowiak Bryan | $86,000 |
Source: Public Records
Tax History
| Year | Tax Paid | Tax Assessment Tax Assessment Total Assessment is a certain percentage of the fair market value that is determined by local assessors to be the total taxable value of land and additions on the property. | Land | Improvement |
|---|---|---|---|---|
| 2025 | $3,468 | $80,080 | $8,400 | $71,680 |
| 2024 | $3,393 | $80,080 | $8,400 | $71,680 |
| 2023 | $2,825 | $59,160 | $7,040 | $52,120 |
| 2022 | $2,702 | $59,160 | $7,040 | $52,120 |
| 2021 | $2,670 | $59,160 | $7,040 | $52,120 |
| 2020 | $2,617 | $54,430 | $7,040 | $47,390 |
| 2019 | $2,682 | $54,430 | $7,040 | $47,390 |
| 2018 | $2,583 | $52,750 | $7,040 | $45,710 |
| 2017 | $2,583 | $52,750 | $7,040 | $45,710 |
| 2016 | $2,562 | $52,750 | $7,040 | $45,710 |
| 2015 | $2,563 | $52,750 | $7,040 | $45,710 |
| 2014 | $2,570 | $52,750 | $7,040 | $45,710 |
| 2013 | $2,541 | $52,750 | $7,040 | $45,710 |
Source: Public Records
Map
Nearby Homes
- 859 N Jewell Rd
- 9088 Horn Rd
- 5177 Nelson Mosier Rd
- 9155 Linden Cir
- 9852 Belden Dr
- 9870 Short Dr
- 9008 Wilverne Dr
- 5007 Nelson Mosier Rd
- 809 State Route 534 NW
- V/L Parkman Rd
- 9300 N Main St
- 9700 Silica Sand Rd
- 0 Mcconnell Rd E Unit 5180297
- 0 Mcconnell Rd E Unit 5179726
- 8935 S Main St
- 0 McConnell East Rd
- 0 Bryant & Sr 82
- 951 State Route 534
- 10481 Knowlton Rd
- 1515 Braceville Robinson Rd
- 9500 Colton Rd
- 9529 Colton Rd
- 9560 Colton Rd
- 10520 State Route 82
- 10570 State Route 82
- 9543 Colton Rd
- 10581 State Route 82
- 10500 State Route 82
- 10494 State Route 82
- 10489 State Route 82
- 9591 Colton Rd
- 9597 Colton Rd
- 9605 Colton Rd
- 9602 Colton Rd
- 10465 State Route 82
- 9615 Colton Rd
- 9637 Colton Rd
- 9487 Shanksdown Rd
- 9640 Colton Rd
- 10436 State Route 82
Your Personal Tour Guide
Ask me questions while you tour the home.