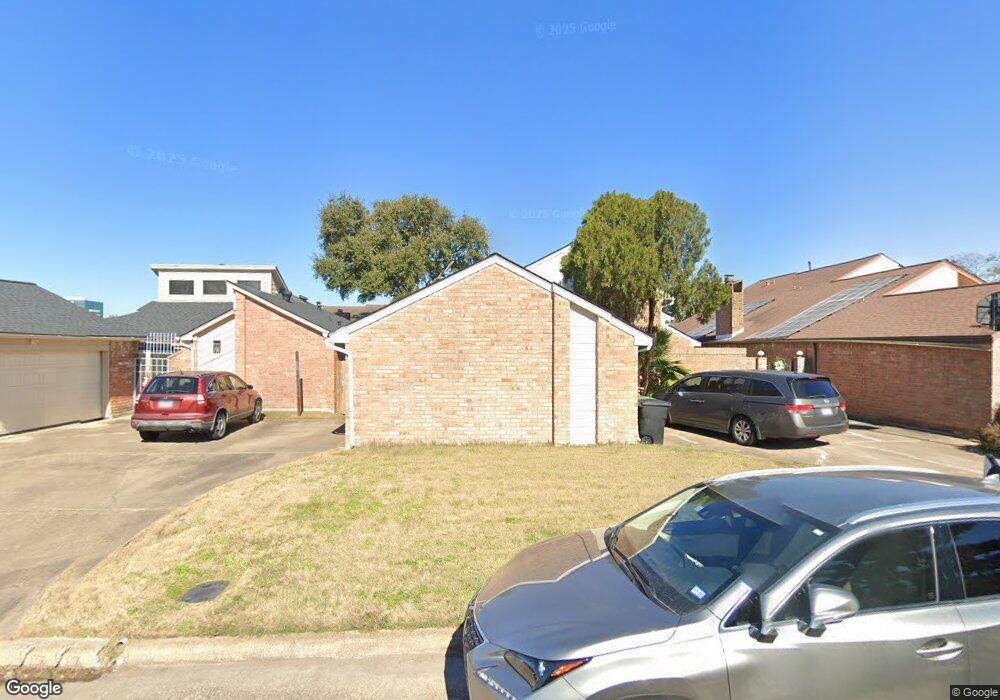
9518 Sandstone St Houston, TX 77036
Chinatown NeighborhoodEstimated Value: $268,000 - $287,000
3
Beds
2
Baths
2,278
Sq Ft
$122/Sq Ft
Est. Value
About This Home
This home is located at 9518 Sandstone St, Houston, TX 77036 and is currently estimated at $278,194, approximately $122 per square foot. 9518 Sandstone St is a home located in Harris County with nearby schools including Bush Elementary School, Owens Intermediate School, and Alief Middle School.
Ownership History
Date
Name
Owned For
Owner Type
Purchase Details
Closed on
May 23, 2006
Sold by
Vu Tien Duc
Bought by
Chen Feng Zhen
Current Estimated Value
Home Financials for this Owner
Home Financials are based on the most recent Mortgage that was taken out on this home.
Original Mortgage
$112,000
Interest Rate
6.5%
Mortgage Type
Fannie Mae Freddie Mac
Purchase Details
Closed on
May 15, 2006
Sold by
Cheng Jackson C
Bought by
Vu Tien Duc
Home Financials for this Owner
Home Financials are based on the most recent Mortgage that was taken out on this home.
Original Mortgage
$112,000
Interest Rate
6.5%
Mortgage Type
Fannie Mae Freddie Mac
Purchase Details
Closed on
Feb 1, 2004
Sold by
Cheng Jackson C
Bought by
Vu Tien Duc
Purchase Details
Closed on
Nov 7, 2001
Sold by
Nguyen Chien Dinh and Nguyen Kim Dung
Bought by
Vu Tien Duc
Purchase Details
Closed on
Jul 9, 1997
Sold by
Vu Tien Duc
Bought by
Nguyen Chein Dinh and Nguyen Kim Dung
Create a Home Valuation Report for This Property
The Home Valuation Report is an in-depth analysis detailing your home's value as well as a comparison with similar homes in the area
Home Values in the Area
Average Home Value in this Area
Purchase History
| Date | Buyer | Sale Price | Title Company |
|---|---|---|---|
| Chen Feng Zhen | -- | Startex Title Company | |
| Vu Tien Duc | -- | None Available | |
| Vu Tien Duc | -- | -- | |
| Cheng Jackson C | -- | -- | |
| Garcia B J | -- | -- | |
| Vu Tien Duc | -- | -- | |
| Nguyen Chein Dinh | -- | Fidelity National Title |
Source: Public Records
Mortgage History
| Date | Status | Borrower | Loan Amount |
|---|---|---|---|
| Closed | Chen Feng Zhen | $112,000 | |
| Closed | Vu Tien Duc | $0 |
Source: Public Records
Tax History Compared to Growth
Tax History
| Year | Tax Paid | Tax Assessment Tax Assessment Total Assessment is a certain percentage of the fair market value that is determined by local assessors to be the total taxable value of land and additions on the property. | Land | Improvement |
|---|---|---|---|---|
| 2025 | $3,864 | $240,678 | $45,000 | $195,678 |
| 2024 | $3,864 | $260,720 | $45,000 | $215,720 |
| 2023 | $3,864 | $279,968 | $45,000 | $234,968 |
| 2022 | $4,812 | $200,000 | $45,000 | $155,000 |
| 2021 | $4,939 | $202,325 | $35,000 | $167,325 |
| 2020 | $4,959 | $199,368 | $35,000 | $164,368 |
| 2019 | $4,724 | $172,800 | $30,000 | $142,800 |
| 2018 | $1,859 | $167,771 | $25,000 | $142,771 |
| 2017 | $4,055 | $152,098 | $18,500 | $133,598 |
| 2016 | $3,686 | $152,098 | $18,500 | $133,598 |
| 2015 | $2,498 | $152,098 | $18,500 | $133,598 |
| 2014 | $2,498 | $112,539 | $18,500 | $94,039 |
Source: Public Records
Map
Nearby Homes
- 9506 Hendon Ln
- 9238 Stroud Dr
- 9215 Sharpcrest St
- 9901 Sharpcrest St Unit K3
- 9901 Sharpcrest St Unit M6
- 9901 Sharpcrest St Unit F3
- 9901 Sharpcrest St Unit B3
- 9901 Sharpcrest St Unit 8
- 9234 Westwood Village Dr Unit 17
- 7939 Kendalia Dr
- 9345 Westwood Village Dr Unit 30
- 9006 Roos Rd
- 9393 Westwood Village Dr Unit 64
- 6633 W Sam Houston Pkwy S Unit 1A
- 6633 W Sam Houston Pkwy S Unit 1G
- 9201 Clarewood Dr Unit 203
- 9201 Clarewood Dr Unit 10
- 9201 Clarewood Dr Unit 204
- 9788 Clarewood Dr Unit 201
- 9788 Clarewood Dr Unit 105
- 9514 Sandstone St
- 9522 Sandstone St
- 9510 Sandstone St
- 9519 Sharpview Dr
- 9602 Sandstone St
- 9523 Sharpview Dr
- 9515 Sharpview Dr
- 9511 Sharpview Dr
- 9606 Sandstone St
- 9506 Sandstone St
- 9519 Sandstone St
- 9515 Sandstone St
- 9523 Sandstone St
- 9507 Sharpview Dr
- 9607 Sharpview Dr
- 9511 Sandstone St
- 9610 Sandstone St
- 9502 Sandstone St
- 9607 Sandstone St
- 9507 Sandstone St