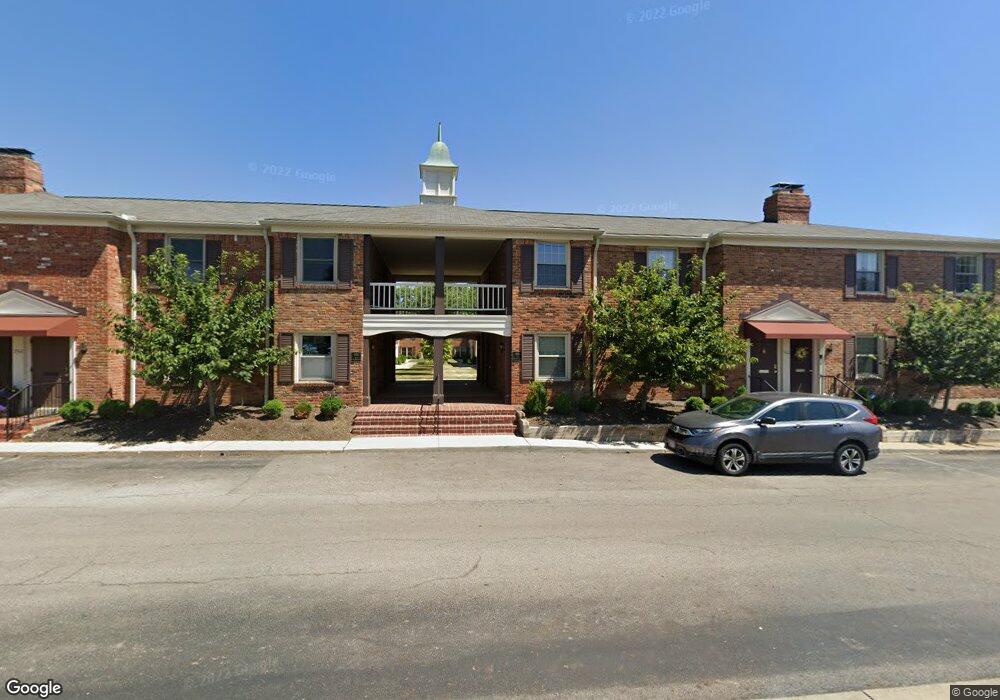
952 Chatham Ln Unit 952B Columbus, OH 43221
Cranbrook NeighborhoodEstimated Value: $283,560 - $334,000
3
Beds
2
Baths
1,690
Sq Ft
$182/Sq Ft
Est. Value
About This Home
This home is located at 952 Chatham Ln Unit 952B, Columbus, OH 43221 and is currently estimated at $307,890, approximately $182 per square foot. 952 Chatham Ln Unit 952B is a home located in Franklin County with nearby schools including Cranbrook Elementary School, Ridgeview Middle School, and Centennial High School.
Ownership History
Date
Name
Owned For
Owner Type
Purchase Details
Closed on
Feb 12, 2013
Sold by
Peiffer Gregory J and Peiffer Linda S
Bought by
Suttner Christopher M
Current Estimated Value
Home Financials for this Owner
Home Financials are based on the most recent Mortgage that was taken out on this home.
Original Mortgage
$116,844
Outstanding Balance
$79,409
Interest Rate
3.12%
Mortgage Type
FHA
Estimated Equity
$228,481
Purchase Details
Closed on
May 6, 2005
Sold by
Carmichael John C and Citino Linda
Bought by
Peiffer Gregory J and Peiffer Linda S
Home Financials for this Owner
Home Financials are based on the most recent Mortgage that was taken out on this home.
Original Mortgage
$247,000
Interest Rate
5.5%
Mortgage Type
Fannie Mae Freddie Mac
Create a Home Valuation Report for This Property
The Home Valuation Report is an in-depth analysis detailing your home's value as well as a comparison with similar homes in the area
Home Values in the Area
Average Home Value in this Area
Purchase History
| Date | Buyer | Sale Price | Title Company |
|---|---|---|---|
| Suttner Christopher M | $119,000 | None Available | |
| Peiffer Gregory J | $147,500 | -- |
Source: Public Records
Mortgage History
| Date | Status | Borrower | Loan Amount |
|---|---|---|---|
| Open | Suttner Christopher M | $116,844 | |
| Previous Owner | Peiffer Gregory J | $247,000 |
Source: Public Records
Tax History Compared to Growth
Tax History
| Year | Tax Paid | Tax Assessment Tax Assessment Total Assessment is a certain percentage of the fair market value that is determined by local assessors to be the total taxable value of land and additions on the property. | Land | Improvement |
|---|---|---|---|---|
| 2025 | $3,475 | $77,430 | $12,780 | $64,650 |
| 2024 | $3,475 | $77,430 | $12,780 | $64,650 |
| 2023 | $3,431 | $77,420 | $12,775 | $64,645 |
| 2022 | $2,694 | $51,940 | $5,040 | $46,900 |
| 2021 | $2,699 | $51,940 | $5,040 | $46,900 |
| 2020 | $2,702 | $51,940 | $5,040 | $46,900 |
| 2019 | $2,627 | $43,300 | $4,200 | $39,100 |
| 2018 | $2,573 | $43,300 | $4,200 | $39,100 |
| 2017 | $2,625 | $43,300 | $4,200 | $39,100 |
| 2016 | $2,782 | $42,000 | $7,350 | $34,650 |
| 2015 | $2,526 | $42,000 | $7,350 | $34,650 |
| 2014 | $2,532 | $42,000 | $7,350 | $34,650 |
| 2013 | $1,249 | $42,000 | $7,350 | $34,650 |
Source: Public Records
Map
Nearby Homes
- 727 Kettering Rd
- 667 Riverview Dr
- 1065 Bernard Rd
- 925 Farnham Rd
- 1530 Pemberton Dr
- 723 Drummond Ct
- 724 Drummond Ct
- 2727 Westmont Blvd
- 3015 Welsford Rd
- 1743 Ardleigh Rd Unit 1743
- 174 W Como Ave
- 222 W North Broadway St
- 94 W Tulane Rd
- 3175 Tremont Rd Unit 504
- 3175 Tremont Rd Unit 313
- 196 W North Broadway St
- 223 W Dunedin Rd
- 745 Highland Dr
- 44 W Pacemont Rd
- 1565 Berkshire Rd
- 952 Chatham Ln Unit 952D
- 952 Chatham Ln Unit 952F
- 952 Chatham Ln Unit 952Q
- 952 Chatham Ln Unit 952M
- 952 Chatham Ln Unit 952R
- 952 Chatham Ln Unit 952L
- 952 Chatham Ln Unit 952N
- 952 Chatham Ln Unit 952G
- 952 Chatham Ln
- 952 Chatham Ln Unit 952P
- 952 Chatham Ln
- 952 Chatham Ln
- 952 Chatham Ln
- 952 Chatham Ln
- 952 Chatham Ln Unit 952A
- 952 Chatham Ln Unit N
- 952 Chatham Ln Unit P
- 952 Chatham Ln Unit G
- 952 Chatham Ln Unit R
- 952 Chatham Ln Unit F