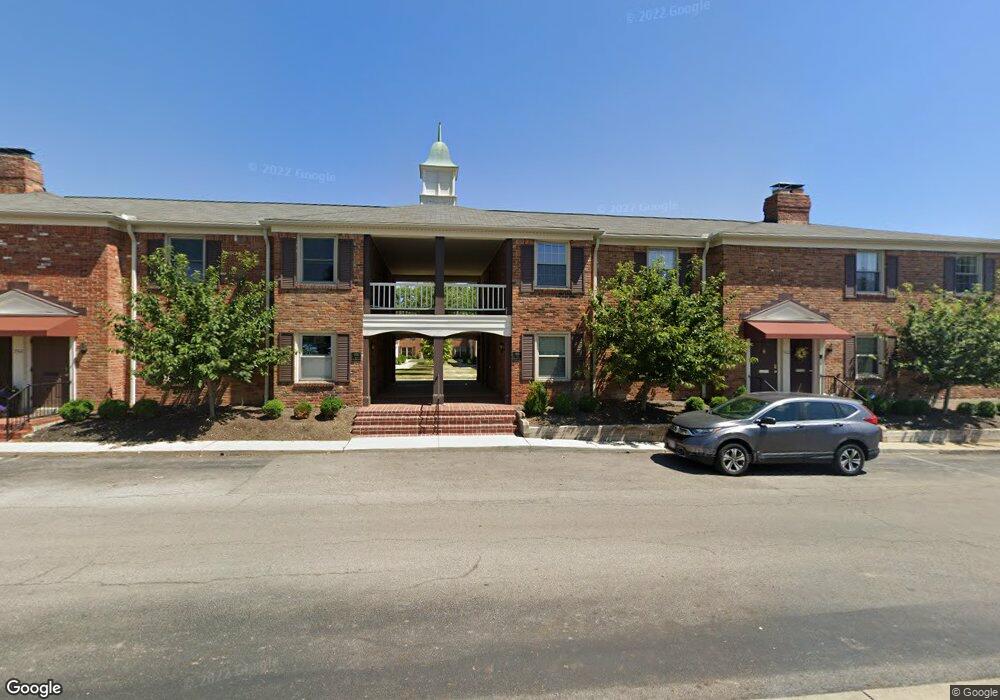
952 Chatham Ln Unit 952D Columbus, OH 43221
Cranbrook NeighborhoodEstimated Value: $192,000 - $211,000
2
Beds
2
Baths
960
Sq Ft
$207/Sq Ft
Est. Value
About This Home
This home is located at 952 Chatham Ln Unit 952D, Columbus, OH 43221 and is currently estimated at $198,623, approximately $206 per square foot. 952 Chatham Ln Unit 952D is a home located in Franklin County with nearby schools including Cranbrook Elementary School, Ridgeview Middle School, and Centennial High School.
Ownership History
Date
Name
Owned For
Owner Type
Purchase Details
Closed on
Apr 18, 2014
Sold by
Braun Nicholas A and Braun Donald W
Bought by
Heil Eric
Current Estimated Value
Home Financials for this Owner
Home Financials are based on the most recent Mortgage that was taken out on this home.
Original Mortgage
$97,850
Outstanding Balance
$74,356
Interest Rate
4.33%
Mortgage Type
New Conventional
Estimated Equity
$124,267
Purchase Details
Closed on
Oct 21, 2003
Sold by
Firestone Caulder Carolyn and Everette Karen L
Bought by
Braun Nicholas A and Braun Donald W
Home Financials for this Owner
Home Financials are based on the most recent Mortgage that was taken out on this home.
Original Mortgage
$87,950
Interest Rate
6.02%
Mortgage Type
FHA
Purchase Details
Closed on
Feb 5, 1999
Sold by
Robbin Lawrence E and Robbin Ruth A
Bought by
Caulder Carolyn Firestone and Everette Karen L
Purchase Details
Closed on
Jan 17, 1984
Bought by
Robbin Lawrence E
Purchase Details
Closed on
Oct 1, 1983
Create a Home Valuation Report for This Property
The Home Valuation Report is an in-depth analysis detailing your home's value as well as a comparison with similar homes in the area
Home Values in the Area
Average Home Value in this Area
Purchase History
| Date | Buyer | Sale Price | Title Company |
|---|---|---|---|
| Heil Eric | $103,000 | Landsel Title | |
| Braun Nicholas A | $90,000 | -- | |
| Caulder Carolyn Firestone | $64,000 | -- | |
| Robbin Lawrence E | -- | -- | |
| -- | $48,000 | -- |
Source: Public Records
Mortgage History
| Date | Status | Borrower | Loan Amount |
|---|---|---|---|
| Open | Heil Eric | $97,850 | |
| Previous Owner | Braun Nicholas A | $87,950 |
Source: Public Records
Tax History Compared to Growth
Tax History
| Year | Tax Paid | Tax Assessment Tax Assessment Total Assessment is a certain percentage of the fair market value that is determined by local assessors to be the total taxable value of land and additions on the property. | Land | Improvement |
|---|---|---|---|---|
| 2024 | $2,897 | $64,550 | $12,780 | $51,770 |
| 2023 | $2,860 | $64,550 | $12,780 | $51,770 |
| 2022 | $2,246 | $43,300 | $5,040 | $38,260 |
| 2021 | $2,250 | $43,300 | $5,040 | $38,260 |
| 2020 | $2,253 | $43,300 | $5,040 | $38,260 |
| 2019 | $2,189 | $36,090 | $4,200 | $31,890 |
| 2018 | $2,071 | $36,090 | $4,200 | $31,890 |
| 2017 | $2,188 | $36,090 | $4,200 | $31,890 |
| 2016 | $2,156 | $32,550 | $5,670 | $26,880 |
| 2015 | $1,957 | $32,550 | $5,670 | $26,880 |
| 2014 | $1,962 | $32,550 | $5,670 | $26,880 |
| 2013 | $968 | $32,550 | $5,670 | $26,880 |
Source: Public Records
Map
Nearby Homes
- 965 Manor Ln Unit W
- 965 Manor Ln Unit P
- 1111 Sunny Hill Dr
- 1098 Stanhope Dr
- 1205 Sunny Hill Dr
- 667 Riverview Dr
- 3311 Mansion Way
- 1121 Afton Rd
- 1016 Lambeth Dr
- 1315 La Rochelle Dr Unit B2U
- 1311 La Rochelle Dr Unit B2L
- 3526 Rue de Fleur Unit B18U
- 2708 Mount Holyoke Rd
- 1560 Pemberton Dr
- 3281 Milton Ave
- 2727 Westmont Blvd
- 187 W Pacemont Rd Unit 189
- 1109 Millcreek Ln
- 143 W Pacemont Rd Unit 145
- 110 W Tulane Rd
- 952 Chatham Ln Unit 952F
- 952 Chatham Ln Unit 952Q
- 952 Chatham Ln Unit 952M
- 952 Chatham Ln Unit 952R
- 952 Chatham Ln Unit 952L
- 952 Chatham Ln Unit 952N
- 952 Chatham Ln Unit 952B
- 952 Chatham Ln Unit 952G
- 952 Chatham Ln
- 952 Chatham Ln Unit 952P
- 952 Chatham Ln
- 952 Chatham Ln
- 952 Chatham Ln
- 952 Chatham Ln
- 952 Chatham Ln Unit 952A
- 952 Chatham Ln Unit N
- 952 Chatham Ln Unit P
- 952 Chatham Ln Unit G
- 952 Chatham Ln Unit R
- 952 Chatham Ln Unit F