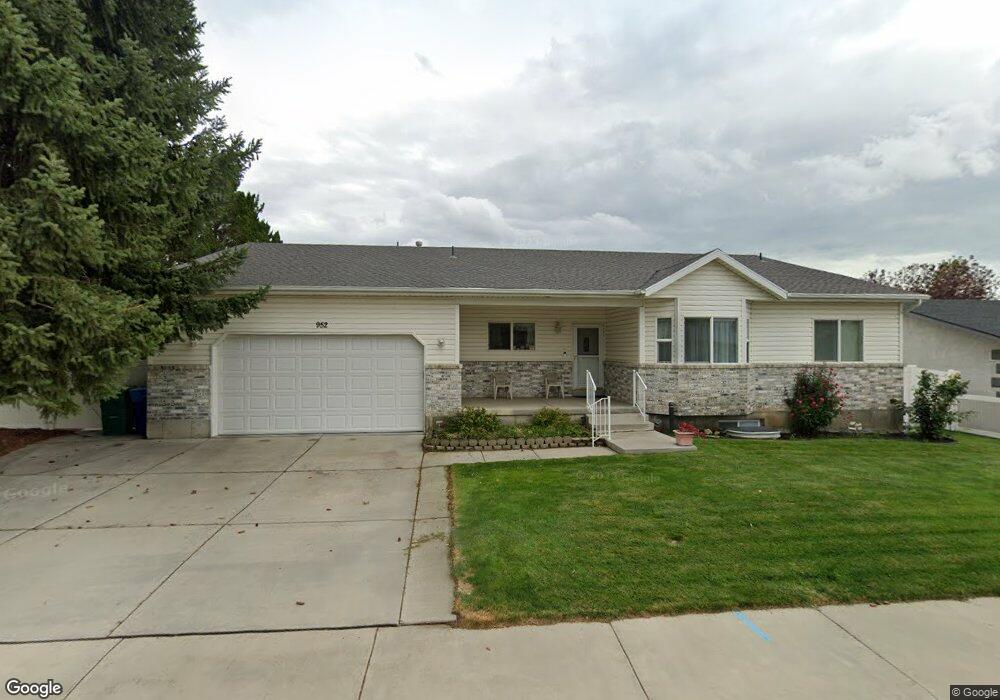
952 E 640 N Orem, UT 84097
Orchard South NeighborhoodEstimated Value: $692,000 - $737,000
4
Beds
5
Baths
2,017
Sq Ft
$351/Sq Ft
Est. Value
About This Home
This home is located at 952 E 640 N, Orem, UT 84097 and is currently estimated at $708,207, approximately $351 per square foot. 952 E 640 N is a home with nearby schools including Foothill Elementary School, Canyon View Junior High School, and Orem High School.
Ownership History
Date
Name
Owned For
Owner Type
Purchase Details
Closed on
Jun 20, 2003
Sold by
Halverson Denise
Bought by
Halverson Denise and Makin Cleo Elvera
Current Estimated Value
Purchase Details
Closed on
Nov 12, 2002
Sold by
American Foundation For Charitable Suppo
Bought by
Halverson Denise
Home Financials for this Owner
Home Financials are based on the most recent Mortgage that was taken out on this home.
Original Mortgage
$188,000
Outstanding Balance
$78,339
Interest Rate
5.95%
Mortgage Type
Construction
Estimated Equity
$629,868
Create a Home Valuation Report for This Property
The Home Valuation Report is an in-depth analysis detailing your home's value as well as a comparison with similar homes in the area
Home Values in the Area
Average Home Value in this Area
Purchase History
| Date | Buyer | Sale Price | Title Company |
|---|---|---|---|
| Halverson Denise | -- | -- | |
| Halverson Denise | -- | Equity Title Agency Inc |
Source: Public Records
Mortgage History
| Date | Status | Borrower | Loan Amount |
|---|---|---|---|
| Open | Halverson Denise | $188,000 |
Source: Public Records
Tax History
| Year | Tax Paid | Tax Assessment Tax Assessment Total Assessment is a certain percentage of the fair market value that is determined by local assessors to be the total taxable value of land and additions on the property. | Land | Improvement |
|---|---|---|---|---|
| 2025 | $564 | $387,970 | -- | -- |
| 2024 | $564 | $352,330 | $0 | $0 |
| 2023 | $2,653 | $348,645 | $0 | $0 |
| 2022 | $2,712 | $345,345 | $0 | $0 |
| 2021 | $2,373 | $457,600 | $151,400 | $306,200 |
| 2020 | $2,223 | $421,300 | $121,100 | $300,200 |
| 2019 | $1,988 | $391,800 | $110,400 | $281,400 |
| 2018 | $1,948 | $366,900 | $106,900 | $260,000 |
| 2017 | $1,938 | $195,470 | $0 | $0 |
| 2016 | $1,894 | $176,165 | $0 | $0 |
| 2015 | $1,981 | $174,240 | $0 | $0 |
| 2014 | $1,902 | $166,540 | $0 | $0 |
Source: Public Records
Map
Nearby Homes
Your Personal Tour Guide
Ask me questions while you tour the home.