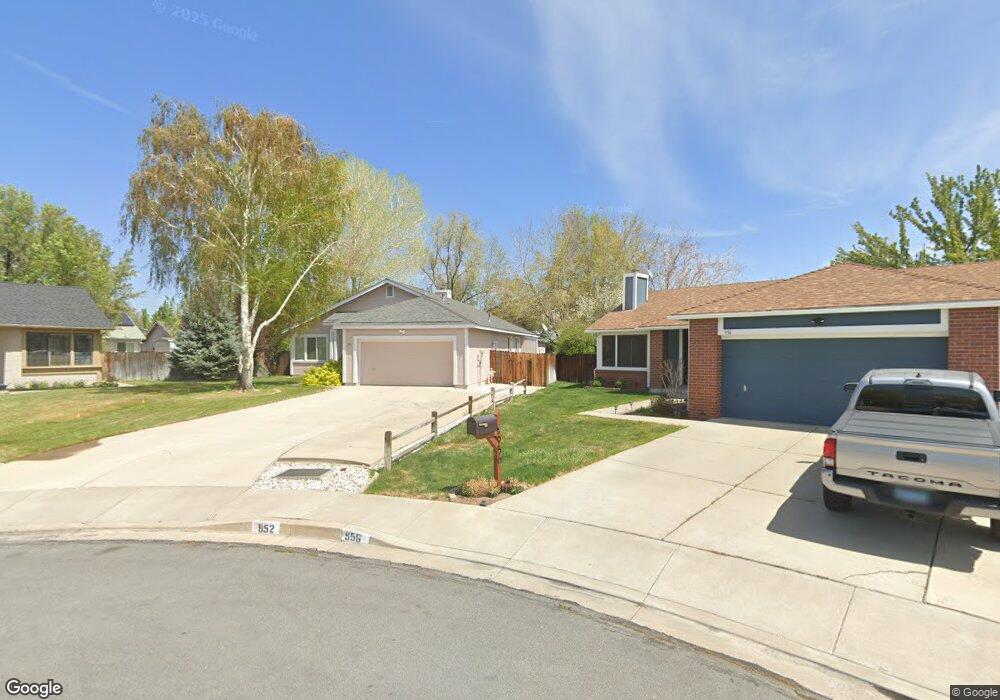
952 Yellow Rose Ct Sparks, NV 89436
Reed NeighborhoodEstimated Value: $519,439 - $555,000
4
Beds
2
Baths
1,849
Sq Ft
$289/Sq Ft
Est. Value
About This Home
This home is located at 952 Yellow Rose Ct, Sparks, NV 89436 and is currently estimated at $533,610, approximately $288 per square foot. 952 Yellow Rose Ct is a home located in Washoe County with nearby schools including Lena Juniper Elementary School, Lou Mendive Middle School, and Edward C Reed High School.
Ownership History
Date
Name
Owned For
Owner Type
Purchase Details
Closed on
Jun 10, 2013
Sold by
Mcpartland Jack S
Bought by
Mcpartland Jack S and Jack S Mcpartland Family Trust
Current Estimated Value
Purchase Details
Closed on
May 4, 2009
Sold by
Mcpartland Jack S
Bought by
Mcpartland Jack S
Home Financials for this Owner
Home Financials are based on the most recent Mortgage that was taken out on this home.
Original Mortgage
$90,000
Interest Rate
4.8%
Mortgage Type
New Conventional
Purchase Details
Closed on
Sep 8, 1997
Sold by
Mcpartland Kirsten D
Bought by
Mcpartland Jack S
Purchase Details
Closed on
May 15, 1997
Sold by
Dilks Robert A and Dilks Jacqueline V
Bought by
Mcpartland Jack S and Mcpartland Kirsten D
Home Financials for this Owner
Home Financials are based on the most recent Mortgage that was taken out on this home.
Original Mortgage
$157,225
Outstanding Balance
$19,644
Interest Rate
8.08%
Estimated Equity
$513,966
Purchase Details
Closed on
Jun 22, 1994
Sold by
Perkins Robert A and Perkins Michelle E
Bought by
Dilks Robert A and Dilks Jacqueline V
Create a Home Valuation Report for This Property
The Home Valuation Report is an in-depth analysis detailing your home's value as well as a comparison with similar homes in the area
Home Values in the Area
Average Home Value in this Area
Purchase History
| Date | Buyer | Sale Price | Title Company |
|---|---|---|---|
| Mcpartland Jack S | -- | None Available | |
| Mcpartland Jack S | -- | Western Title Inc Ridge | |
| Mcpartland Jack S | -- | Stewart Title | |
| Mcpartland Jack S | $165,500 | Stewart Title | |
| Dilks Robert A | $156,000 | Founders Title Company |
Source: Public Records
Mortgage History
| Date | Status | Borrower | Loan Amount |
|---|---|---|---|
| Closed | Mcpartland Jack S | $90,000 | |
| Open | Mcpartland Jack S | $157,225 |
Source: Public Records
Tax History
| Year | Tax Paid | Tax Assessment Tax Assessment Total Assessment is a certain percentage of the fair market value that is determined by local assessors to be the total taxable value of land and additions on the property. | Land | Improvement |
|---|---|---|---|---|
| 2026 | -- | $84,910 | $36,890 | $48,020 |
| 2024 | $2,207 | $83,287 | $33,215 | $50,072 |
| 2023 | $2,144 | $82,982 | $35,175 | $47,807 |
| 2022 | $2,082 | $66,889 | $26,740 | $40,149 |
| 2021 | $2,022 | $61,962 | $21,735 | $40,227 |
| 2020 | $1,962 | $61,290 | $20,720 | $40,570 |
| 2019 | $1,904 | $60,185 | $20,720 | $39,465 |
| 2018 | $1,850 | $53,297 | $14,455 | $38,842 |
| 2017 | $1,796 | $52,836 | $13,720 | $39,116 |
| 2016 | $1,751 | $52,436 | $12,250 | $40,186 |
| 2015 | $442 | $50,752 | $10,325 | $40,427 |
| 2014 | $1,696 | $48,048 | $9,030 | $39,018 |
| 2013 | -- | $45,364 | $6,860 | $38,504 |
Source: Public Records
Map
Nearby Homes
- 3602 Oakridge Dr
- 3592 Oakridge Dr
- 3988 Ella Jayne Ct Unit Lot 6
- 1069 Palmwood Dr
- 930 Spanish Springs Rd
- 867 Spanish Springs Rd
- 1041 Baywood Dr Unit D
- 1029 Baywood Dr Unit D
- 3273 N Truckee Ln
- 1381 Laser Ct
- 3126 N Truckee Ln
- 3122 Shari Way
- 1472 Giannotti Dr
- 3104 Sandy St
- 1522 Satellite Dr
- 491 E Emerson Way
- 1074 Glen Martin Dr
- 913 Glen Molly Dr
- 889 Glen Molly Dr
- 481 S Sand Crane Cir
- 946 Yellow Rose Ct
- 956 Yellow Rose Ct
- 965 Bernice Ct
- 3565 Oakridge Dr
- 3575 Oakridge Dr
- 955 Bernice Ct
- 3555 Oakridge Dr
- 962 Yellow Rose Ct
- 975 Bernice Ct
- 942 Yellow Rose Ct
- 945 Bernice Ct
- 3545 Oakridge Dr
- 985 Bernice Ct
- 936 Yellow Rose Ct
- 935 Bernice Ct
- 932 Yellow Rose Ct
- 835 Bernice Ct
- 3562 Oakridge Dr
- 925 Bernice Ct
- 2516 Oakridge Dr
Your Personal Tour Guide
Ask me questions while you tour the home.