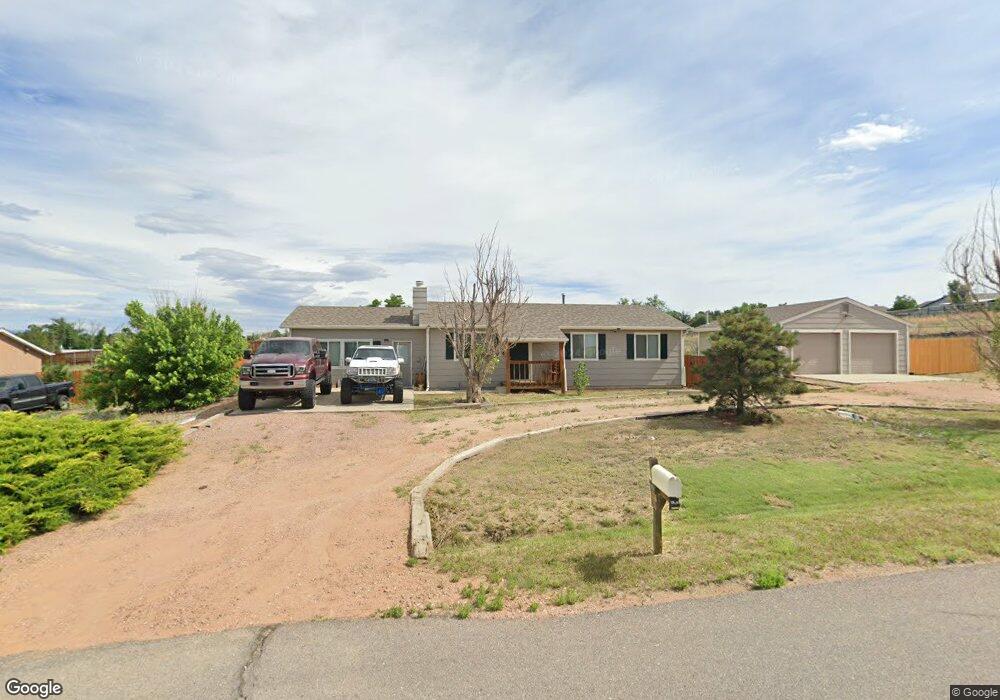
9520 Bar B Rd Fountain, CO 80817
Central Fountain Valley NeighborhoodEstimated Value: $384,000 - $443,000
3
Beds
1
Bath
1,460
Sq Ft
$276/Sq Ft
Est. Value
About This Home
This home is located at 9520 Bar B Rd, Fountain, CO 80817 and is currently estimated at $402,730, approximately $275 per square foot. 9520 Bar B Rd is a home located in El Paso County with nearby schools including Jordahl Elementary School, Fountain Middle School, and Fountain-Fort Carson High School.
Ownership History
Date
Name
Owned For
Owner Type
Purchase Details
Closed on
Jul 13, 2018
Sold by
Tomaskovic Andrew P
Bought by
Warrington Chad W
Current Estimated Value
Home Financials for this Owner
Home Financials are based on the most recent Mortgage that was taken out on this home.
Original Mortgage
$260,200
Outstanding Balance
$229,118
Interest Rate
5.25%
Mortgage Type
FHA
Estimated Equity
$173,612
Purchase Details
Closed on
Feb 28, 2000
Sold by
Eaglen Dawn
Bought by
Tomaskovic Andrew P
Home Financials for this Owner
Home Financials are based on the most recent Mortgage that was taken out on this home.
Original Mortgage
$87,125
Interest Rate
8.31%
Purchase Details
Closed on
May 30, 1991
Bought by
Tomaskovic Andrew P
Purchase Details
Closed on
May 1, 1990
Bought by
Tomaskovic Andrew P
Purchase Details
Closed on
Apr 1, 1985
Bought by
Tomaskovic Andrew P
Create a Home Valuation Report for This Property
The Home Valuation Report is an in-depth analysis detailing your home's value as well as a comparison with similar homes in the area
Home Values in the Area
Average Home Value in this Area
Purchase History
| Date | Buyer | Sale Price | Title Company |
|---|---|---|---|
| Warrington Chad W | $265,000 | Land Title Guarantee Co | |
| Tomaskovic Andrew P | $102,500 | -- | |
| Tomaskovic Andrew P | -- | -- | |
| Tomaskovic Andrew P | -- | -- | |
| Tomaskovic Andrew P | -- | -- |
Source: Public Records
Mortgage History
| Date | Status | Borrower | Loan Amount |
|---|---|---|---|
| Open | Warrington Chad W | $260,200 | |
| Previous Owner | Tomaskovic Andrew P | $87,125 |
Source: Public Records
Tax History Compared to Growth
Tax History
| Year | Tax Paid | Tax Assessment Tax Assessment Total Assessment is a certain percentage of the fair market value that is determined by local assessors to be the total taxable value of land and additions on the property. | Land | Improvement |
|---|---|---|---|---|
| 2025 | $1,519 | $27,850 | -- | -- |
| 2024 | $1,360 | $28,850 | $4,690 | $24,160 |
| 2022 | $1,099 | $18,840 | $3,930 | $14,910 |
| 2021 | $1,021 | $19,390 | $4,050 | $15,340 |
| 2020 | $775 | $14,410 | $3,540 | $10,870 |
| 2019 | $761 | $14,410 | $3,540 | $10,870 |
| 2018 | $654 | $11,960 | $2,590 | $9,370 |
| 2017 | $646 | $11,960 | $2,590 | $9,370 |
| 2016 | $643 | $11,900 | $3,180 | $8,720 |
| 2015 | $644 | $11,900 | $3,180 | $8,720 |
| 2014 | $573 | $10,650 | $3,180 | $7,470 |
Source: Public Records
Map
Nearby Homes
- 9430 Bar B Rd
- 10910 Double d Rd
- 9715 Bar B Rd
- 12 Arrow H Rd
- 10555 Flying F Rd
- 11155 Falling Star Rd
- 10624 Delaney Ln
- 908 Candlestar Loop N
- 995 Square Dance Ln
- 10617 Darneal Dr
- 277 Turf Trail Place
- 871 Barn Owl Dr
- 919 Rancher Dr
- 850 Barn Owl Dr
- 895 Rancher Dr Unit FOU
- 843 Hayloft Ln
- 724 Daffodil St
- 11360 Berry Farm Rd
- 11288 Berry Farm Rd
- 7740 Blue Heron Ct
- 10820 Bar B Ln
- 9510 Bar B Rd
- 9530 Bar B Rd
- 9525 Bar B Rd
- 10825 Bar B Ln
- 9440 Bar B Rd
- 9535 Bar B Rd
- 9515 Bar B Rd
- 10845 Falling Star Rd
- 10940 Double d Rd
- 10835 Falling Star Rd
- 10930 Double d Rd
- 9545 Bar B Rd
- 9445 Bar B Rd
- 10815 Bar B Ln
- 10855 Falling Star Rd
- 10920 Double d Rd
- 9310 Bar B Rd
- 9435 Bar B Rd
- 9610 Bar B Rd