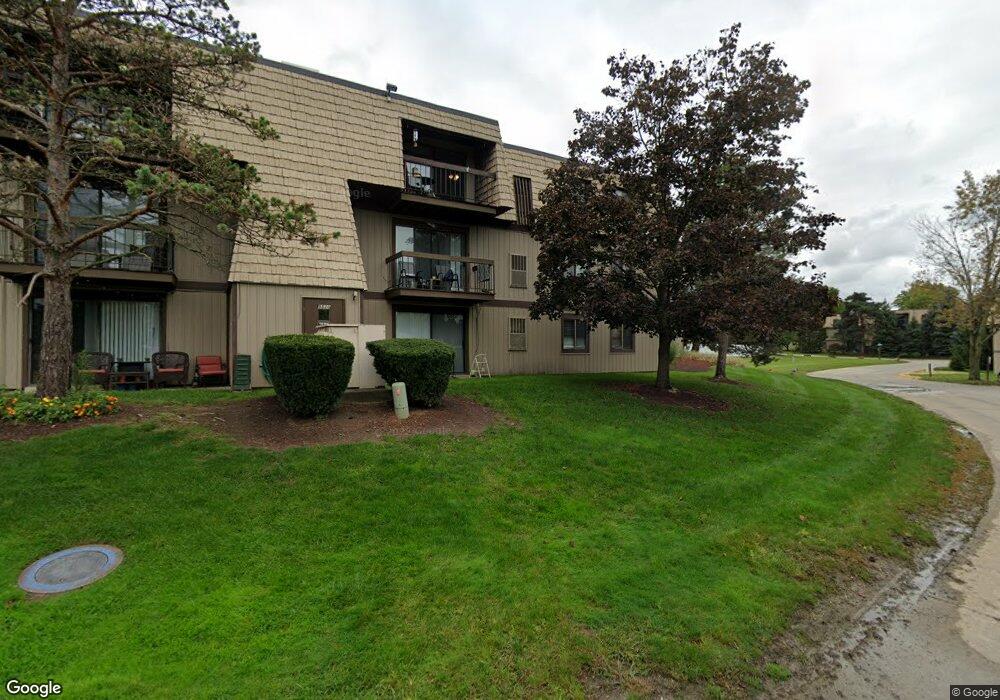
9520 Cove Dr Unit 19C North Royalton, OH 44133
Estimated Value: $95,683 - $142,000
2
Beds
2
Baths
903
Sq Ft
$132/Sq Ft
Est. Value
About This Home
This home is located at 9520 Cove Dr Unit 19C, North Royalton, OH 44133 and is currently estimated at $118,842, approximately $131 per square foot. 9520 Cove Dr Unit 19C is a home located in Cuyahoga County with nearby schools including North Royalton Middle School, North Royalton High School, and Saint Albert the Great Roman Catholic School.
Ownership History
Date
Name
Owned For
Owner Type
Purchase Details
Closed on
Jan 5, 2022
Sold by
Terrence Odonnell
Bought by
Fragias Constantinos and Frangias Maria
Current Estimated Value
Purchase Details
Closed on
Jan 12, 1999
Sold by
Wenner Patricia L
Bought by
Odonnell Thomas J
Home Financials for this Owner
Home Financials are based on the most recent Mortgage that was taken out on this home.
Original Mortgage
$68,748
Interest Rate
6.79%
Mortgage Type
VA
Purchase Details
Closed on
Jul 11, 1996
Sold by
Hapney Gregory A
Bought by
Wenner Patricia L
Purchase Details
Closed on
Jan 18, 1994
Sold by
Hapney Gregory A
Bought by
Hapney Gregory A
Purchase Details
Closed on
Nov 27, 1991
Sold by
Fiorentino Dominic F
Bought by
Hapney Gregory A
Purchase Details
Closed on
Apr 28, 1989
Sold by
Oleff John N and Oleff Thelma M
Bought by
Fiorentino Dominic F
Purchase Details
Closed on
Jan 1, 1978
Bought by
Oleff John N and Oleff Thelma M
Create a Home Valuation Report for This Property
The Home Valuation Report is an in-depth analysis detailing your home's value as well as a comparison with similar homes in the area
Home Values in the Area
Average Home Value in this Area
Purchase History
| Date | Buyer | Sale Price | Title Company |
|---|---|---|---|
| Fragias Constantinos | $77,000 | Cleveland Home Title | |
| Odonnell Thomas J | $67,400 | -- | |
| Wenner Patricia L | $61,500 | -- | |
| Hapney Gregory A | -- | -- | |
| Hapney Gregory A | $57,000 | -- | |
| Fiorentino Dominic F | $51,500 | -- | |
| Oleff John N | -- | -- |
Source: Public Records
Mortgage History
| Date | Status | Borrower | Loan Amount |
|---|---|---|---|
| Previous Owner | Odonnell Thomas J | $68,748 |
Source: Public Records
Tax History Compared to Growth
Tax History
| Year | Tax Paid | Tax Assessment Tax Assessment Total Assessment is a certain percentage of the fair market value that is determined by local assessors to be the total taxable value of land and additions on the property. | Land | Improvement |
|---|---|---|---|---|
| 2024 | $1,738 | $29,925 | $3,465 | $26,460 |
| 2023 | $1,448 | $22,860 | $2,310 | $20,550 |
| 2022 | $1,438 | $22,860 | $2,310 | $20,550 |
| 2021 | $1,453 | $22,860 | $2,310 | $20,550 |
| 2020 | $1,159 | $17,330 | $1,750 | $15,580 |
| 2019 | $1,125 | $49,500 | $5,000 | $44,500 |
| 2018 | $1,137 | $17,330 | $1,750 | $15,580 |
| 2017 | $1,167 | $16,980 | $1,720 | $15,260 |
| 2016 | $1,093 | $16,980 | $1,720 | $15,260 |
| 2015 | $1,093 | $16,980 | $1,720 | $15,260 |
| 2014 | $1,377 | $21,220 | $2,140 | $19,080 |
Source: Public Records
Map
Nearby Homes
- 9530 Cove Dr Unit C-25
- 9510 Cove Dr Unit C12
- 9611 Sunrise Blvd Unit K2
- 9660 Cove Dr Unit F13
- 11550 York Rd
- 9710 Cove Dr Unit 23G
- 9800 Cove Dr Unit H2
- 9761 Sunrise Blvd
- 10364 Independence Dr Unit 19c
- 10342 Independence Dr Unit 21B
- 9821 Sunrise Blvd Unit o1
- 10560 Independence Dr Unit 25A
- 11445 Harbour Light Dr
- 9035 Wallings Rd
- 11650 Harbour Light Dr Unit 1650
- 10641 Albion Rd
- 11806 Harbour Light Dr Unit 1806
- 12906 Cartwright Pkwy
- 13000 Cartwright Pkwy
- 12701 Gordon St
- 9530 Cove Dr Unit C27
- 9510 Cove Dr Unit C1
- 9530 Cove C-32
- 9530 Cove Dr Unit C35
- 9510 Cove Dr Unit 9C
- 9510 Cove Dr
- 9510 Cove Dr Unit 12C
- 9530 Cove Dr Unit 33C
- 9510 Cove Dr Unit 10C
- 9510 Cove Dr Unit 1C
- 9530 Cove Dr Unit C36
- 9520 Cove Dr Unit 15C
- 9530 Cove Dr Unit 35C
- 9520 Cove Dr Unit C21
- 9530 Cove Dr Unit 34C
- 9520 Cove Dr Unit 17C
- 9520 Cove Dr Unit 16C
- 9530 Cove Dr Unit 30C
- 9530 Cove Dr Unit 26C
- 9510 Cove Dr Unit 4C